We’re extremely pleased to announce Maxio’s new Monthly Recurring Revenue (MRR) analytics.
MRR is one of the most important bottom line metrics for subscription businesses. Maxio’s MRR analytics give you a crystal clear view into net MRR growth and the composition of MRR movements:
- New Business MRR:
New paid conversions - Expansion MRR:
Paying customers that have upgraded or increased add-ons/extras - Contraction MRR:
Paying customers that have downgraded or decreased add-ons/extras - Churn MRR:
Paying customers that have canceled or downgraded to a free plan - Reactivation MRR:
Previous paying customers that churned and then reactivated
Since Maxio is the direct link between your customers and revenue related events, we’re uniquely advantaged to understand when, what, and why revenue changes are happening. This especially applies for complex MRR use cases that we elegantly handle using smart logic. The result is beautiful, accurate insights that your business can rely on.
These analytics are now available via the Analytics tab of your Maxio Site. We’re confident you’ll love what you see.
How is MRR calculated?
At the core, MRR is a normalized measurement of recurring revenue. Plans that are not monthly will be calculated based on the amount and frequency. For example, an annual plan of $1200/year will yield an MRR value of $100 ($1200/12 months).
We made choices that align with MRR best practices along with some smart logic to handle common edge cases.
Coupons and Discounts
Coupons are removed from plan charges before arriving at your MRR numbers. A new subscriber to your $100/mo plan using a 20% off, 3-month coupon would reflect $80 MRR for the first 3 months followed by $100 in MRR (of which $20 is expansion MRR) when the coupon expires.
Adjustments and Credits
Occasionally you may apply temporary service credits for individual subscribers. For example, a $100/mo subscriber may have a bad experience and is given $20 off their next bill as a goodwill gesture. We would maintain an MRR of $100 for this subscriber. Even though you will only collect $80 in this month from this subscriber, they are still valued at $100/mo.
On the other hand, some subscribers may be comped an amount that exceeds their monthly bill. We consider this an MRR impacting event and will adjust MRR down when the credit is applied and back up with the credit expires. In short: partial service credits do not affect MRR, while long-term credits do affect MRR.
Smart Logic
If you have measured MRR in the past, you know there are always edge cases that are not as clear cut and easy to automatically calculate. We’ve built in smart logic to accommodate common edge cases, leaving you with the most accurate metrics that your company can rely on.
For example, you have a customer convert to a paid plan at $50/mo but immediately realize they selected the wrong plan. They then “upgrade” to the $100/mo plan. Many MRR reports will count this as $50 in New Business MRR followed by $50 in Expansion MRR. In reality, you have $100 in New Business MRR since that was their original intent. The path the customer took could cause confusion, but Maxio’s smart logic understands what is supposed to happen and adjusts accordingly.
There are many other best practices and edge cases that we have baked into our MRR analytics. For the full list, check out our documentation.
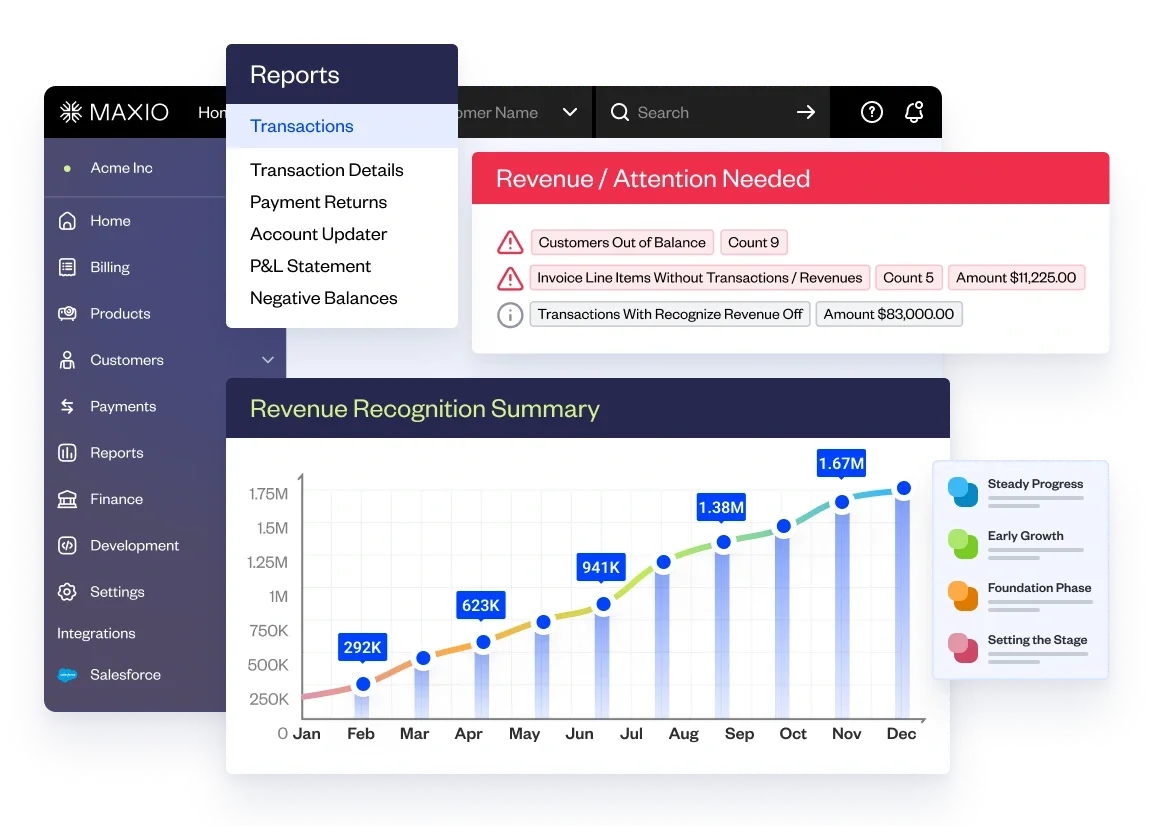
Report Overview
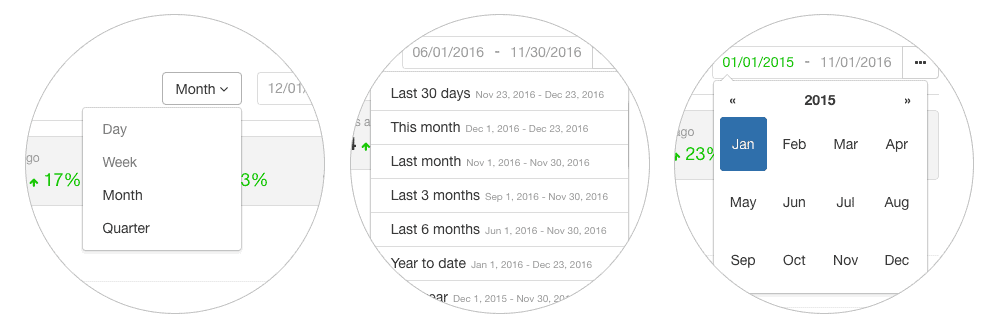
For any of the metrics below, you can sort the data by date range and frequency:
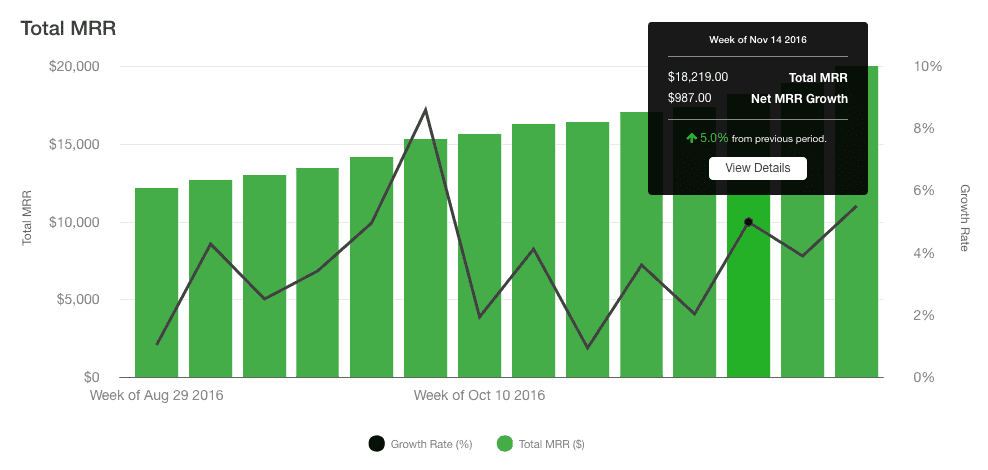
MRR Growth
These are the incremental changes in MRR from movement events, beautifully displayed in an easy to digest chart. Hover over any column to see the movement breakdown and amounts.

Movements Table
All of the movement data is also presented in tabular format below the chart above. Here you will find revenue along with the corresponding event counts.
Clicking individual cells zooms in on activity that contributed to that particular MRR Movement.
Filter each view by the amount or date by clicking in the top cell. If you want to further investigate an event, click on the customer to go directly to their Maxio subscription summary.
Total MRR
This graph represents the Period End MRR along with MRR Growth Rate (as a percentage) that trends up or down over time in response to your MRR Movements.
Learn more about how to access and use these analytics in our documentation.
Use Cases
At Maxio, we’ve been “eating our own dog food” while building out these analytics. From our first hand experience, we’ve seen how powerful these insights can be.
- See how New Business MRR is looking month-to-date to project if we’re on track to meet monthly conversions numbers and revenue
- Analyze month-end movements to identify trends and compare against initiatives
- Understand negative churn where Expansion MRR is greater than Churn MRR Contraction MRR
- Research seasonal factors such as summer months or holidays from historical trends
- Compare quarterly growth rates against quarterly company goals
- Set future goals based on educated decisions from historical growth insights
It’s hard to quantify the number of use cases since every business is different, but the new analytics have been extremely helpful internally when looking to answer the questions above…and that’s just the tip of the iceberg.
Daily MRR Summary Emails
In the top right corner of the MRR report, you’ll see an “MRR Settings” link. In the settings you can enable daily MRR summary emails that will update you everyday on MRR impacting movements from the previous day. Now you can keep an eye on the heath of your business without leaving your inbox!
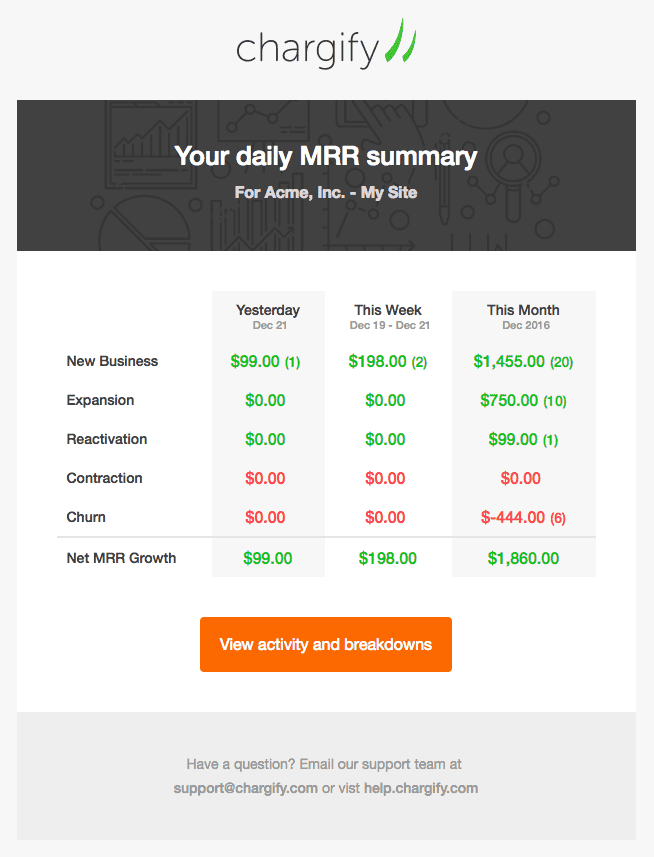
Sample MRR Daily Summary Email
Feedback
Our team has worked hard to build an intuitive user experience, and most importantly, accurate metrics that your business can rely on. Your feedback is extremely important to us as we continue to iterate and improve.
If you have feedback or feel like any numbers are off, please submit a support ticket. Don’t hesitate to reach out—we’re here to help!
What’s Next?
The MRR report is the building block for many analytics improvements to come in early 2017. The following are either underway or planned:
- Customer Counts:
The raw volume of customers in your install base, including how they are growing and churning, independent of revenue. - Financial Data:
We consider MRR an “operational metric.” It guides your tactics and decisions, but it doesn’t flow directly to your financial statements. We’ve got some accountant-friendly Sales & Cash Reports coming down the pipe to give you a 360° view of your company. - Component/Add-On Choices:
We’ve made some default choices on which types of components/add-ons are included in MRR and which are non-recurring usage revenue. Soon, you’ll be able to make that choice yourself for more control.
We look forward to helping your company make smart choices as we roll out our analytics improvements over the coming months. Let us know in the comments below if there is anything else you would like to see on our analytics roadmap.