What if you could gain a deeper understanding of your SaaS business without having to dig through data or filter through an Excel or Google Sheet with endless tabs?
It just so happens, there is a way. It all starts with running a SaaS cohort analysis.
Running a cohort analysis allows SaaS businesses to quickly understand and benchmark how different customer cohorts, product lines, and subscription tiers are trending over time when compared to similar cohorts.
But what exactly is a cohort analysis, and why does it matter? In this guide to cohort analysis in SaaS, we’ll cover the basics of cohort analyses, their significance for SaaS companies, and real-world applications that showcase just how helpful this analytics method really is.
What is a SaaS cohort analysis, exactly?
A cohort analysis refers to the study of groups of users based on shared characteristics over a period of time.
In startups and SaaS businesses, it typically involves analyzing groups of customers based on the timeframe when they signed up for a product. So, for example, a January 2023 cohort would refer to the number of customers who signed up in January 2023. Their customer behavior, usage, engagement, and retention patterns would then be analyzed over subsequent months to uncover opportunities to nurture, retain, or monetize your existing user base.
By tracking different groups of active user cohorts over time, businesses can also identify trends in their product usage, churn rates, and customer lifetime value. The insights gleaned from running these analyses can also directly inform decisions around product development, pricing models, customer retention, and even the marketing strategies that are being used to attract new customers.
How does a SaaS cohort analysis work?
Conceptually, the process of running a cohort analysis is quite similar to the scientific method.
For example, a revenue cohort analysis starts with forming a hypothesis about customer revenue behaviors, selecting a cohort of customers to with common characteristics, observing revenue metrics over time, detecting patterns related to customer lifetime value (LTV) or retention rates, forming insights into factors driving revenue growth or decline, and making decisions based on available data.
The cycle is then repeated by testing new hypotheses on different cohorts to gain new cohort data.
In the context of SaaS, cohorts typically refer to groups of customers based on the week, month, or quarter when they signed up for a product. So, for example, a Q3 2022 Cohort would refer to users who signed up anytime between July 1 and September 30, 2022. You can then continue to monitor their behaviors over time on a monthly, quarterly, and annual basis.
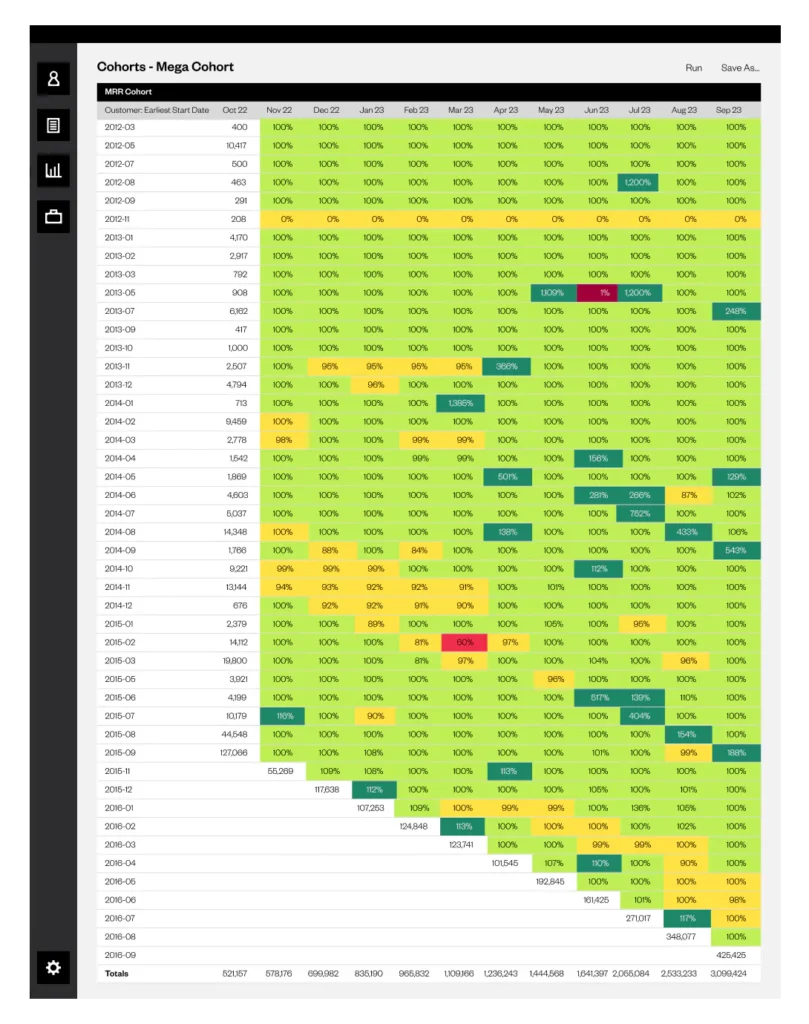
Here’s an example of what a monthly recurring revenue cohort analysis looks like using Maxio’s subscription momentum report:

Through examination of the rows in your cohort chart, you can determine if the average revenue generated by specific cohorts acquired at that time is growing or shrinking relative to customers from similar cohorts.
You can then apply this same practice study other KPIs – like your retention metrics by performing a retention analysis that involves comparing the average user retention of customers in similar behavioral cohorts.
Using cohort analyses to reduce SaaS churn and increase renewals
Reducing churn rates and increasing customer lifetime values are crucial to the success of any SaaS company worth its salt. But you can’t diagnose the underlying fluctuations behind these quarterly or monthly metrics unless you have accurate data on hand.
By tracking the customer journey from initial signup, SaaS companies can identify patterns that may lead certain users to eventually churn. This is where the benefits of cohort analysis really shine—especially in SaaS.
For example, does low engagement in the first month correlate strongly to churn down the line? Or are other factors at play? Do the marketing efforts of your marketing team have anything to do with positive or negative cohort performance in a given period?
Performing a cohort study gives you insights into what’s actually causing these user behaviors.
Additionally, running a cohort analysis also reveals opportunities to reduce your customer acquisition costs (CAC) across your user base. By running a cohort analysis to compare customers with different CAC ratios, you can determine how your acquisition channels, pricing plan, marketing campaigns, and customer success efforts affect the average CAC of new users and existing users across your customer base.
How to perform a SaaS cohort analysis in 6 steps
Although the fundamentals of performing a SaaS cohort analysis seem simple, performing an accurate analysis requires careful preparation. SaaS companies typically track many interconnected metrics across customer types, product offerings, usage events, and income streams. To precisely monitor cohort trends over time, your analysts will need to properly link these disparate data sources to ensure your data can be analyzed properly.
Leaders must also decide the exact cohort definitions, time frames, and metrics to analyze. For a revenue cohort analysis, for example, cohorts are defined based on the acquisition or signup date of the customer.
While this data can be lassoed together using an API or data pipeline, investing in purpose-built SaaS analytics software like Maxio requires much less work and far more accurate results. (You can check out Maxio’s metrics and analytics page to learn more.)
Whether you choose to use purpose-built software, an API, or collect all of these data points manually, here’s the quick six-step process for running a cohort analysis:
1. Identify the cohorts you want to analyze
Define a clear cohort to focus your analysis on a specific product line or customer segment (e.g. customers who purchased Product A in January 2023).
2. Select the appropriate cohort period
Choose a cohort period that aligns with your business model and goals. For SaaS businesses, monthly or quarterly cohorts are the most common.
3. Connect your data points
If you’re not using purpose-built analytics software, you’ll need to manually link your customer profile data to behavioral event data like customer sign-ups, purchases, and engagements with your software. You can use customer or product IDs to connect records over time and then bring your data together into a longitudinal data set.
4. Visualize cohort trends in charts
Once you’ve collected your data, create line charts that aggregate and plot your target metrics for each defined cohort over time. Visualizing your data will make it easy for business leaders and stakeholders to quickly understand how your cohorts are performing over time without having to perform an in-depth technical analysis.
5. Analyze your cohorts to uncover opportunities
After you have visualized your cohorts, you can identify any positive and negative variances across your individual cohort segments. If you notice any positive or negative outliers across your cohorts, you can then dig deeper to uncover the underlying reason behind the positive or negative change in the data.
For example, if you’re performing a revenue cohort analysis and you notice a quarterly period with a downward trend, you can work backward and analyze any leading indicators that may have resulted in the loss of ARR or MRR during this period.
6. Continue iterating on your cohort analyses
Finally, one of the most important best practices for performing a SaaS cohort analysis is consistency. Maintaining your cohort analyses on a monthly basis (at most) will give you unparalleled visibility into the health of your SaaS business over time.
The importance of leading vs. lagging metrics in your SaaS cohort analysis
When analyzing SaaS Cohorts, it’s critical to understand the difference between leading and lagging indicators. Leading metrics are those that predict future behavior, while lagging metrics trail behind user actions.
For example, metrics like signup rates, feature engagement, and app sessions in the first month all represent leading metrics. These metrics can then be used to forecast subscription conversion rates, expansion revenue, and customer churn rates in the future.
In contrast, business metrics like monthly recurring revenue, the number of support tickets a business receives each month, and subscriber churn rates are all lagging indicators. These metrics reflect downstream outcomes based on earlier user experiences.
By distinguishing leading vs lagging metrics within sequential cohort periods, SaaS leaders can better connect the dots between their early user experiences and future business outcomes.
Performing your first cohort analysis? Here are a few pitfalls to avoid
Like any other data analysis method, it’s easy to accidentally skew or ruin the results of a cohort analysis unless you set it up correctly. If you plan on manually building your cohort analyses from scratch, here are a few key pitfalls you should avoid.
1. Failing to maintain consistent cohort definitions
Defining your cohorts inconsistently by using different criteria for each data set can completely obscure any real trends in your cohort analysis. In other words, if you want to ensure your cohort analyses are accurate 100% of the time, you need to maintain consistent cohort definitions based on signups, product usage, or behaviors.
2. Choosing inappropriate cohort periods
Additionally, choosing inappropriate cohort periods could cause business leaders or key stakeholders to miss important data trends. A perfect example of this would be a business quarter that shows a slight increase in revenue growth without drilling down into the month-by-month numbers. Even if your revenue per user is trending positively, a quarterly cohort analysis could gloss over negative trends in a monthly period.
3. Manipulating your cohort analysis data
Finally, cherry-picking or selectively choosing your data points to achieve a specific or desired outcome will undermine the integrity of your cohort analysis data and render it useless.
For example, a business leader may report cohort trends on a quarterly basis to hide a particular month or week when business performance tanked. While this scenario is unlikely, it demonstrates how manipulating your cohort analysis makes it nearly impossible to assess the health of your business.
By understanding and avoiding these common pitfalls, SaaS leaders can ensure their cohort analysis efforts provide the raw, reliable insights they need to make informed decisions about the future of their business.
The different types of cohort analysis in SaaS
So far, we’ve talked mainly about revenue cohort analyses, as they directly address the financial health of a SaaS business. However, there are many other forms of cohort analysis that SaaS leaders can perform depending on their use case.
Here are a few of the common types of cohort analysis methods SaaS leaders can use:
- Acquisition cohort analysis: This type of cohort analysis is used to analyze SaaS metrics like onboarding completion and net dollar retention or customer retention based on user signup periods.
- Engagement cohort analysis: Using this type of analysis, you can compare user engagement metrics over time across individual cohorts.
- Behavioral analysis: This type of customer cohort analysis allows you to study behavioral metrics such as product utilization, account upgrades, and time-to-first transaction.
- Churn cohort analysis: A churn cohort analysis can be used to study patterns in user drop-offs and subscriber churn of your users over time.
- Time-based cohort analysis: A time-based cohort groups users that share the same initial engagement timeframe, such as sign-up date, typically assigned in monthly or quarterly periods. Analyzing business metrics across these cohorts allows SaaS leaders to benchmark business performance across customer lifecycles.
Performing your SaaS cohort analysis with Maxio
For SaaS businesses that rely on long-term customer value, a cohort analysis is an incredibly powerful tool for benchmarking business performance. Not only does it help business leaders identify immediate opportunities to improve their company’s performance, but it also helps them forecast future scenarios and adjust their strategic plans and product decisions accordingly.
Want to unlock actionable insights for your SaaS business? With Maxio’s metrics and analytics tools, you’ll gain a deeper understanding of the underlying causes behind key performance trends in your business.
Ready to put your data to work and improve your business performance? Schedule a demo to learn more.

