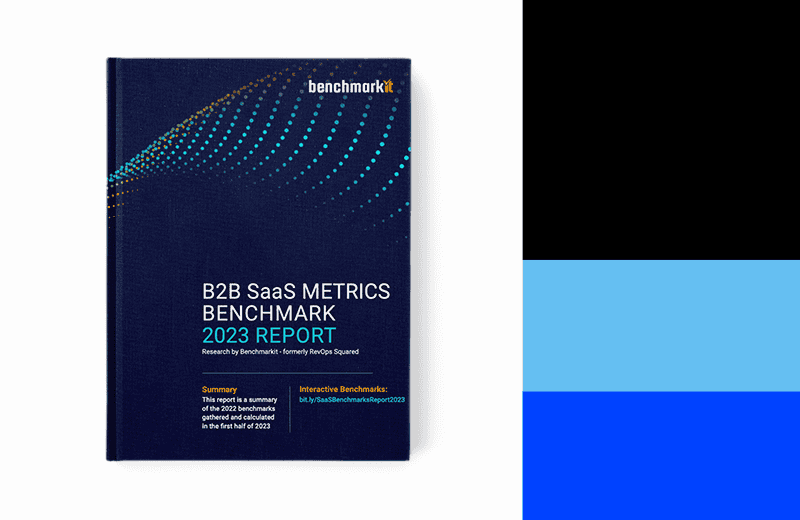
Despite the wide availability of public company data, it’s difficult to gauge what’s happening in the private markets at any given moment. This has created a pretty big appetite for SaaS owners and operators who want a reliable way to benchmark their company’s performance. Enter Benchmarkit’s (formerly RevOps Squared) 2023 B2B SaaS Benchmarks Report.
The data collected in this report contains 17 B2B SaaS metrics grouped into five categories including:
- Capital efficiency
- Operational efficiency
- Customer acquisition
- Customer expansion
- Customer retention
It was then segmented into cohorts by using the following company segmentation attributes:
- Company size
- Average annual contract value
- Distribution model
- Target customer market
- Solution type
- Go-to-market motion
- Primary financing source
- Company HQ location
Key takeaways from this year’s SaaS benchmarks report
- Growth rates decreased in 2022 In 2022, growth rates witnessed a decline, settling at a median of 30% across the entire population. The latter half of 2022 experienced a decrease in growth rates primarily attributed to reduced win rates, elongated sales cycles, and a progressively cautious capital environment.
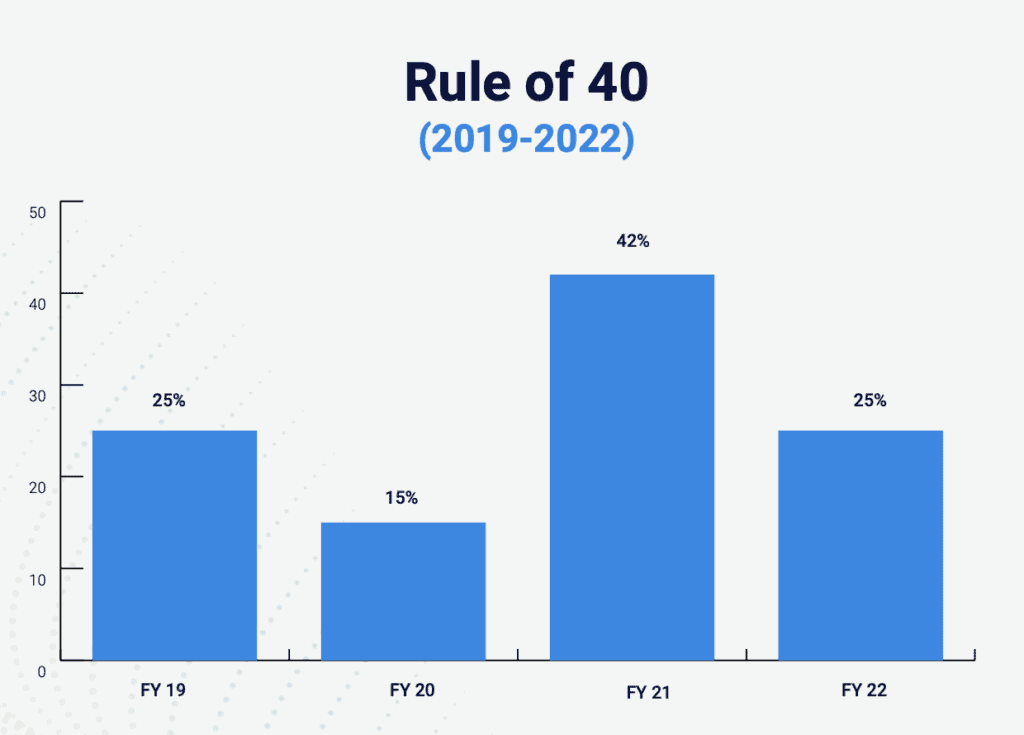
- Rule of 40 experienced a reduction in 2022
Following a robust upswing in 2021, there was a decline in the Rule of 40, which signifies the decreased growth rates observed in 2022 and the subsequent postponement of a substantial reduction in operating expenses until the first half of 2023. - CAC Payback Period saw a slight increase CAC Payback Period increased due to reduced close rates in 2H-22 and lower new ARR. The Payback Period is directly impacted by the velocity of new ARR which experienced a reduction in 2H-22 and operating expense reductions did not keep pace until late Q422 and Q123.
- Net Revenue Retention was level to 2022, while Gross Revenue Retention experienced a slight increase
Net Revenue Retention rates continued to be a top priority in 2022, however, expansion ARR experienced the same reduced velocity and win rates in 2H-22 that impacted New ARR.
Download the 2023 SaaS Benchmarking Report
undefined
The state of the Rule of 40: Growth Rate EBITDA
The Rule of 40 is easily one of the most talked about metrics among investors and finance leaders in 2023… but for what reason?
The Rule of 40 is a hallmark of a B2B SaaS company’s enterprise value, which has traditionally been based upon a multiple of the next twelve months (NTM) revenue, versus the traditional price-to-earnings ratio used in more mature industries and markets.
The Rule of 40 benchmarks for the survey respondents decreased in 2022 across the majority of cohorts. This was largely driven by a decrease in growth rates versus 2021 and decreased EBITDA across all participants.
While companies across cohorts were affected by decreased growth rates, EBITDA pressures increased in the scaling stages of companies ($5M–$100M), and increased significantly in the >$100M ARR cohort.
How important is the Rule of 40 for early-stage companies?
While the Rule of 40 is great for measuring revenue growth against profitability, it’s often artificially elevated by the higher growth rates found in the <$5M ARR cohort.
Therefore, it’s more beneficial for early-stage companies to benchmark their success based on product market fit, customer acquisition, and then revenue growth efficiency as they scale from $5M to $10M and above.
What’s happening with company growth rates?
Growth rates fell from the hyper-growth levels in 2021 and are closer to the reduced levels of growth experienced in 2020. Growth rates decreased across every company size with a median growth rate of 30% in 2022 versus 42% in 2021.
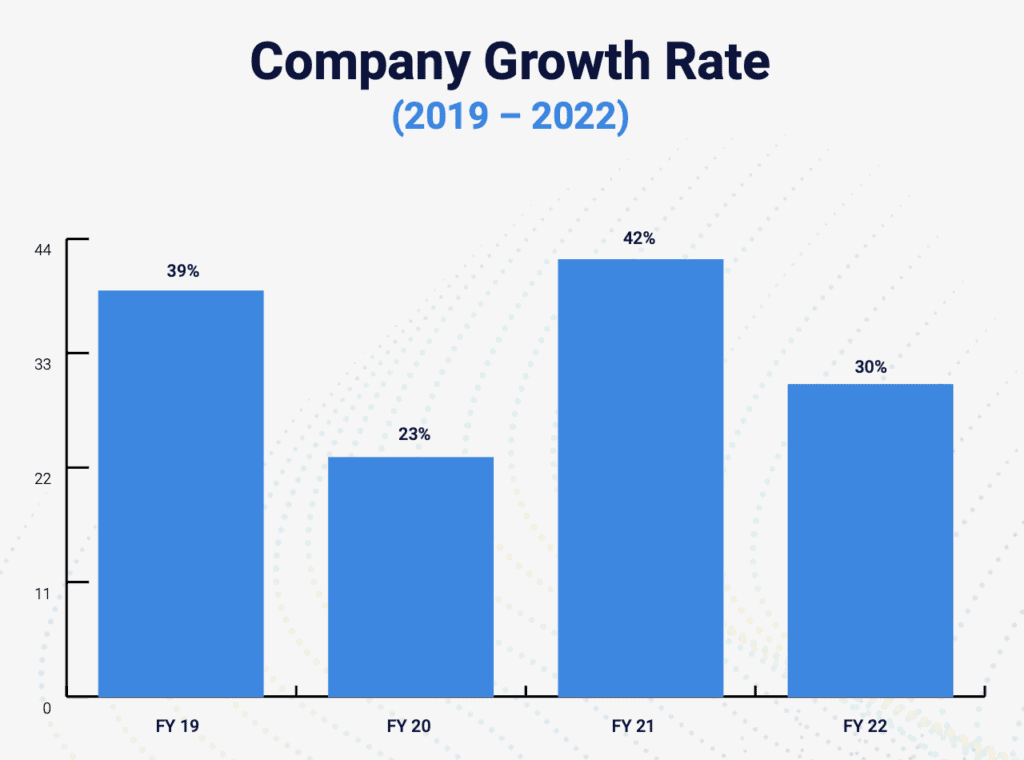
Company growth rates encountered various challenges across all segments, largely influenced by the decline in SaaS spending during the second half of 2022, which persisted into the first half of 2023.
In 2023, it is of utmost importance to measure and optimize CAC (Customer Acquisition Cost) efficiency metrics while placing a heightened emphasis on expansion ARR as a percentage of total growth ARR. The return of growth rates as the primary metric impacting enterprise value in Q2-23, reclaiming its position from the Rule of 40, further underscores its significance.
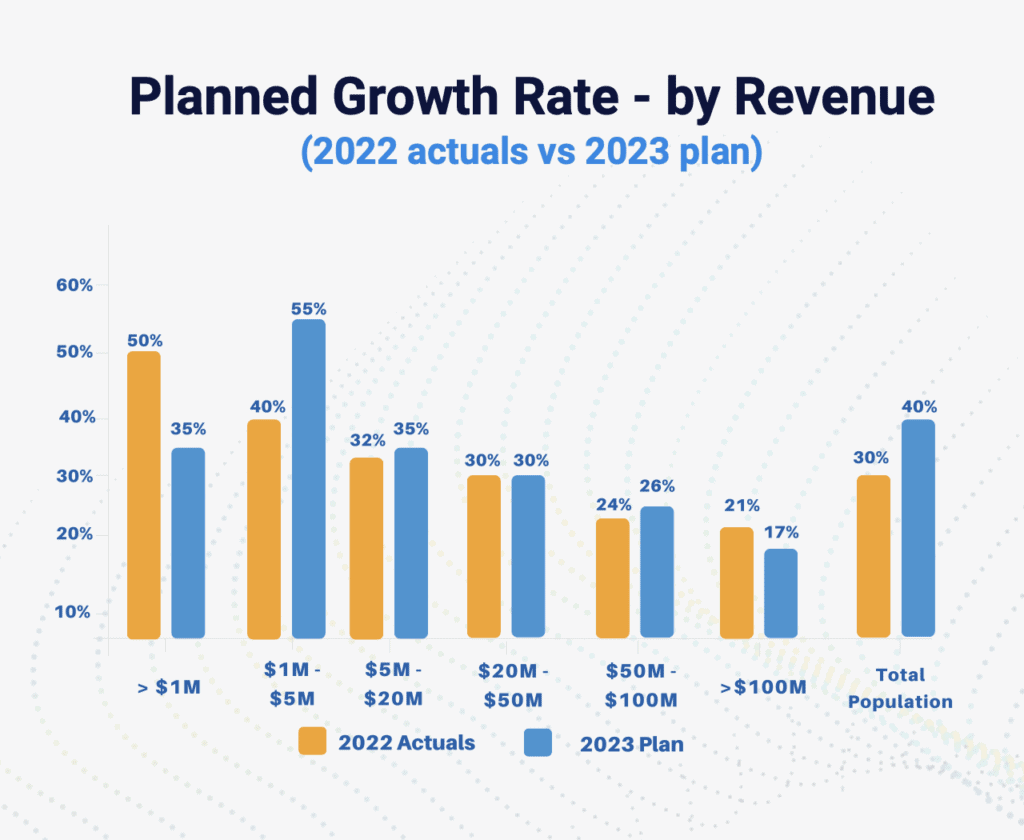
Leading up to 2023, it was widely observed that companies were proactively strategizing for reduced growth rates and implementing cost-saving measures to extend their cash runways.
Interestingly, despite the common occurrence of reductions in Marketing and Sales expenses, it was notable that every segment, except for companies in the <$1M ARR and >$100M ARR range, planned for similar or higher growth rates in 2023.
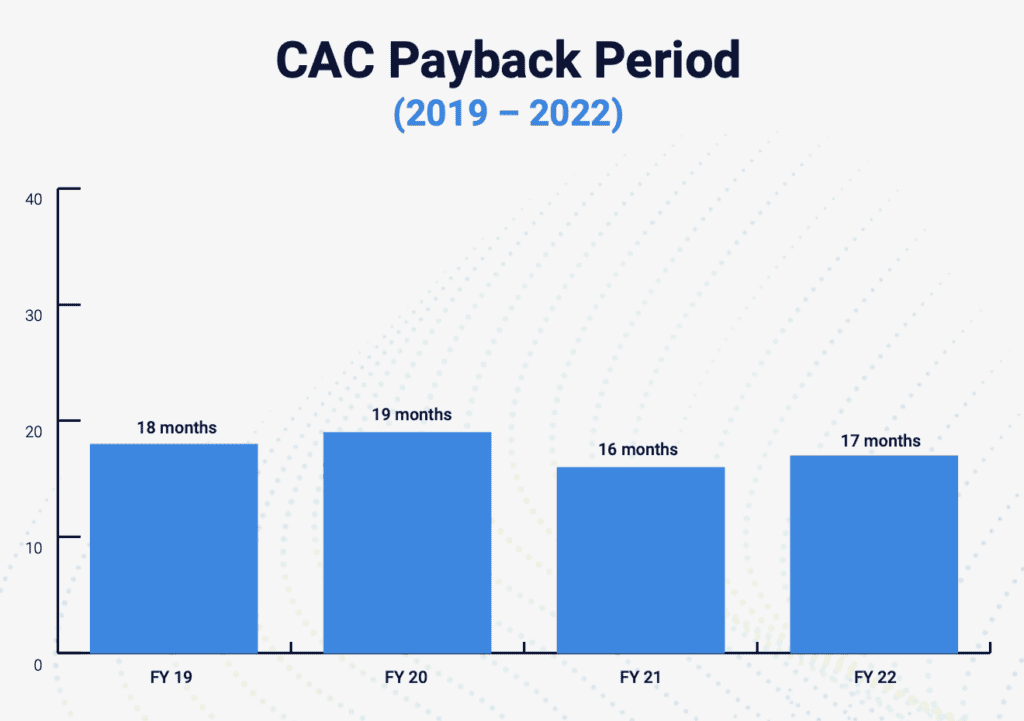
Customer Acquisition benchmarks
The CAC Payback Period for the entire population rose to a median of 17 months, indicating a one-month increase compared to the previous year’s benchmark.
It’s important to note that the CAC Payback Period focuses solely on acquiring new customer logos and remains unaffected by existing customer expansion ARR. This metric demonstrates a strong correlation between annual contract value and Sales and Marketing expenses.
The CAC Payback Period is subject to monthly fluctuations, particularly in the enterprise and commercial markets. These fluctuations can occur when a given month or quarter includes deals that significantly deviate from the typical Average Contract Value (ACV), such as an elephant deal that is 2x to 3x higher than the average ACV.
To account for these fluctuations and normalize any exceptional outliers in a single month or quarter, it’s advised to measure the CAC Payback Period over a rolling time frame of three, six, and twelve months. This approach provides a more accurate and reliable assessment of the metric.
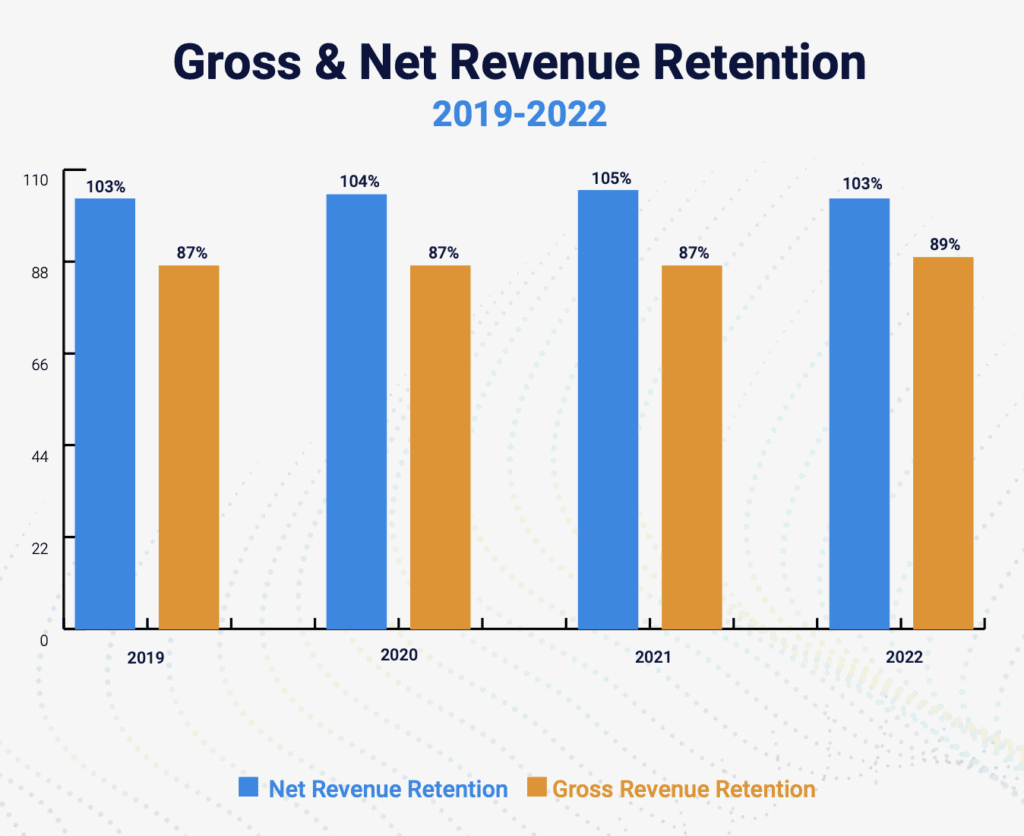
Customer retention benchmarks
Over the past three years, Gross Revenue Retention (GRR) demonstrated consistent stability. However, this year it witnessed a 2% rise to 89%.
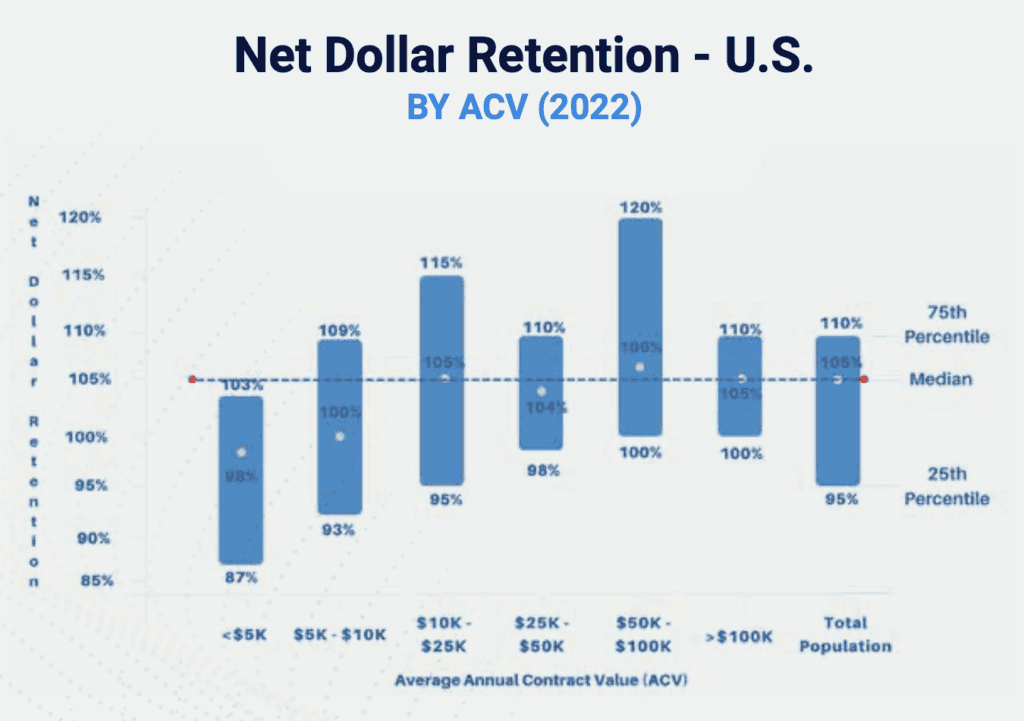
In North America, Net Revenue Retention (NRR) among the primary participant cohort remained steady at 105%. When considering the higher proportion of global participants this year, the median NRR stood at a median of 103%.
Customer expansion benchmarks
While customer retention is vital for keeping a business afloat, healthy customer expansion is the ultimate driver of combined top-line revenue growth and revenue efficiency.
Net Revenue Retention (NRR), also known as Net Dollar Retention (NDR), compares the ARR of a cohort of customers at the beginning and end of the accounting period to their ARR from a previous period.
Net Revenue Retention is typically annualized and should be calculated on a rolling three, six, and twelve-month period.
According to this year’s benchmark report, Net Revenue Retention exhibits a higher correlation to Annual Contract Value (ACV) than to company size. As ACV increases, the opportunity for expansion is more prevalent, though not as correlated with GTM motion and pricing.
Another factor in Net Revenue Retention is the breadth of the product portfolio. The pricing has built-in escalators based on usage or product features. For example, Maxio gives SaaS companies access to dozens of different SaaS billing models and arrangements—one of the primary levers SaaS leaders can pull to achieve customer expansion.
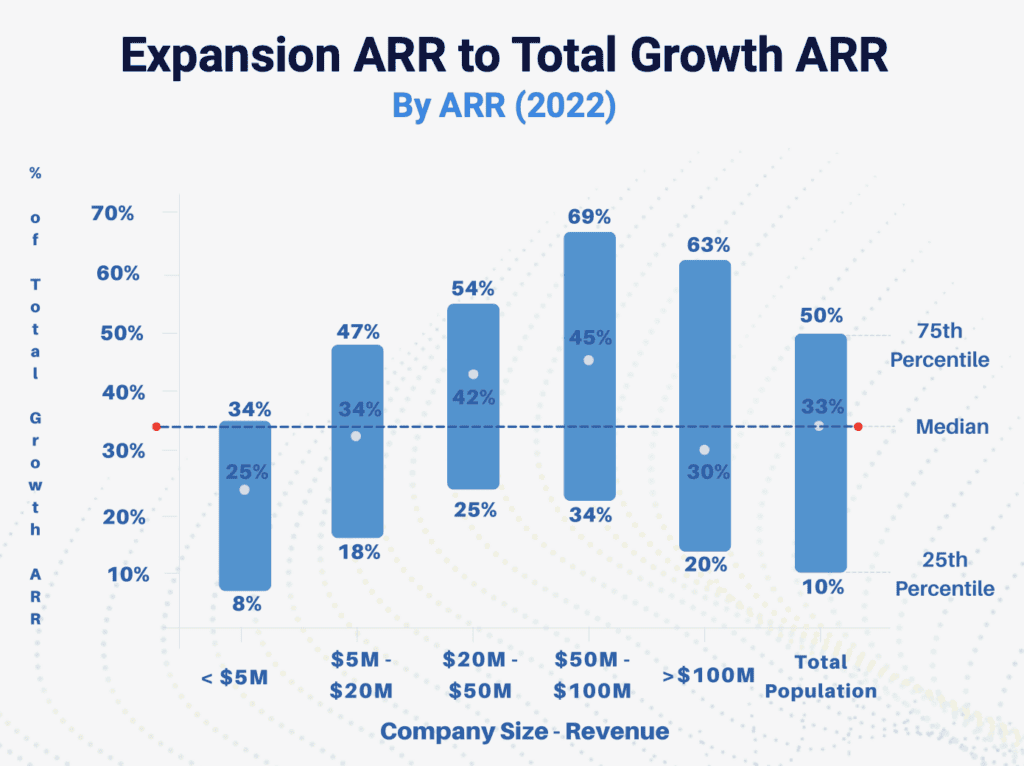
How customer expansion impacts total revenue growth
This year’s benchmark report highlights an interesting observation: larger companies have the potential to achieve operating leverage and boost Net Revenue Retention (NRR). This is evident from their median contribution of 42% in the $20M–$50M cohort and 45% in the $50M–$100M cohort in terms of expansion Annual Recurring Revenue (ARR).
Notably, expansion ARR is known to be 2x to 3x more efficient to acquire. As SaaS owners and operators continue to pursue capital efficiency, expansion ARR will continue to act as a key indicator of company performance.
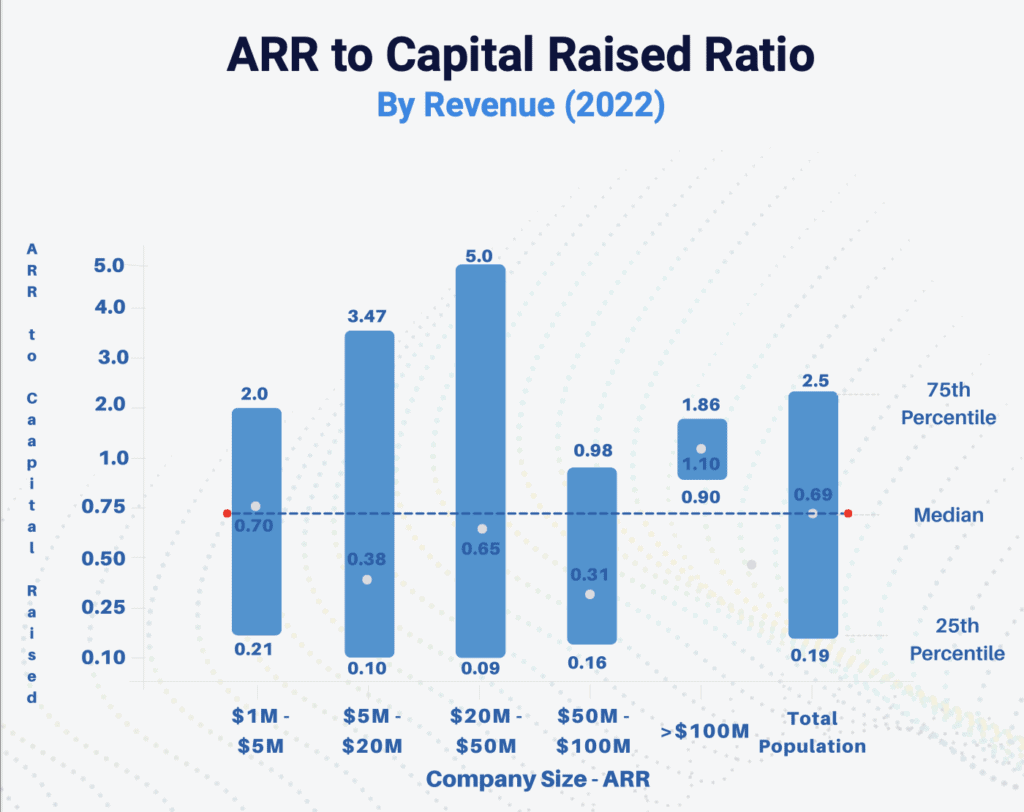
Capital efficiency Benchmarks
The ratio of Annual Recurring Revenue (ARR) to Capital Raised serves as an investor-centric metric that offers valuable insights into capital efficiency. Evaluating this metric requires considering the stage of growth and the corresponding growth rate.
Ideally, SaaS leaders should try to attain an ARR to Capital Raised ratio exceeding 1.0. In the case of VC-backed companies, this milestone is typically reached in the $50M range and beyond.
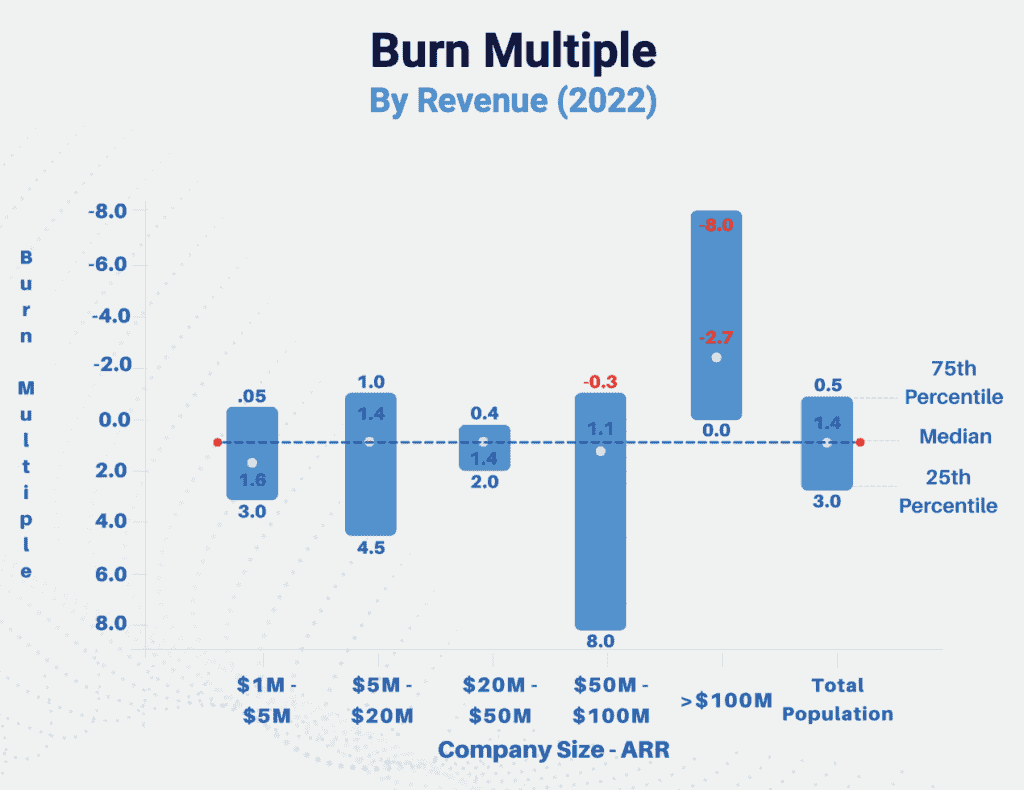
While ARR to capital raised helps measure the possibility of future returns, a company’s burn multiple is a primary indicator of capital efficiency.
For context, he burn multiple—first introduced by David Sacks at Craft Ventures—is a capital efficiency metric that measures how much capital is being consumed to grow each dollar of ARR.
Companies that have a burn multiple under 1.0x are typically viewed as the most capital-efficient growth companies. Those falling within the 1.0 to 1.5 range are still considered favorable, however, a burn multiple exceeding 2.0 is typically a cause for concern among investors.
Takeaways for SaaS leaders. What comes next?
The data contained in this year’s B2B SaaS metrics report is a powerful resource for benchmarking performance against SaaS companies with similar revenue ranges, company sizes, GTM models, and solution types—but what you do with this data is just as important.
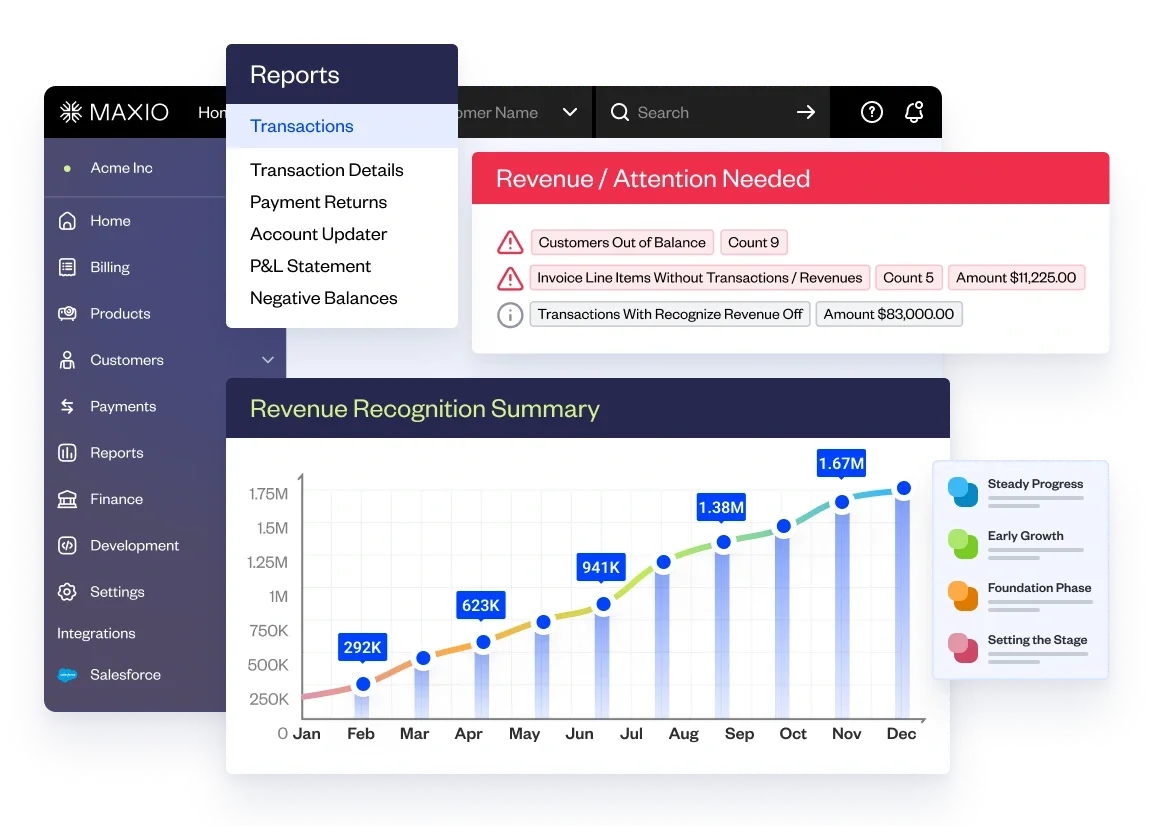
Based on this year’s findings, revenue efficiency and expansion continue to be top of mind for investors and executives alike. With a FinOps solution like Maxio, you’ll have access to SaaS metrics, billing, and subscription management capabilities that make it easy to keep a pulse on your company’s performance and achieve revenue efficiency.
Request a demo to see Maxio is helping over 2,000 B2B SaaS companies minimize their spend and maximize their growth.
Alec Beard is a writer in the B2B SaaS industry and founder of StoryWon. His work has been featured in SaaS Brief, and in similar industry blogs for Driven Insights and Churnkey. When he’s not writing about SaaS or Finance, you can find him tucked in a local coffee shop or cruising around on the Atlanta Beltline.