
Updated May 2026: This article has been refreshed to reflect the latest SaaS benchmark data
SaaS companies rely on measurable performance data to understand how well they’re growing and retaining customers. Tracking the right metrics makes it easier to spot patterns in revenue and customer value. Without consistent measurement, teams risk missing early signs of churn or weak cash flow.
SaaS metrics connect financial performance with customer behavior. They reveal how product decisions and pricing affect long-term results. Accurate, repeatable tracking gives leaders confidence in forecasts and keeps teams aligned around measurable goals.
The margin for error is slim when building a successful B2B SaaS company, which makes measuring the right metrics at the right time essential. This guide outlines the most important SaaS metrics for understanding performance and driving sustainable growth. By tracking and analyzing them consistently, you can improve forecasting and make more informed decisions across your business.
Key Takeaways
- Tracking the right SaaS metrics helps you understand revenue patterns, customer behavior, and long-term stability.
- Financial metrics like MRR, ARR, and ACV show how predictable your income is and how well your pricing plans perform.
- Retention metrics such as churn, NRR, and renewal rate reveal the strength of customer relationships and the health of your subscription base.
- Acquisition metrics like CAC and activation rate help you see how efficiently you turn new users into paying customers.
- Reviewing these metrics often gives you better forecasts, sharper decisions, and a clearer path to steady growth.
What are SaaS metrics?
SaaS metrics provide a clear measure of how a subscription business performs over time. They reveal customer behavior, revenue patterns, and the overall health of daily operations. Since recurring payments shape the software-as-a-service model, tracking these numbers helps teams understand long-term financial stability and the strength of their customer base.
Many of these SaaS metrics are not found in your traditional P&L, so ensuring appropriate processes and systems are in place to create visibility to these metrics is critical. Regularly reviewing these metrics helps leaders spot changes, see how product and pricing choices affect results, and adjust plans with reliable data. They offer a clear view of how well the business attracts and retains customers, guiding decisions that support steady growth.
15 Key SaaS metrics every SaaS business should track
Knowing which numbers actually matter can make or break a SaaS company’s growth. These 15 key SaaS metrics give you a complete picture of how your business is performing and where you can improve.
Financial health and revenue metrics
The following financial health SaaS revenue metrics show how consistently your income flows in and how efficiently your business generates and manages revenue. Tracking these financial metrics helps you understand growth, performance, and overall financial health.
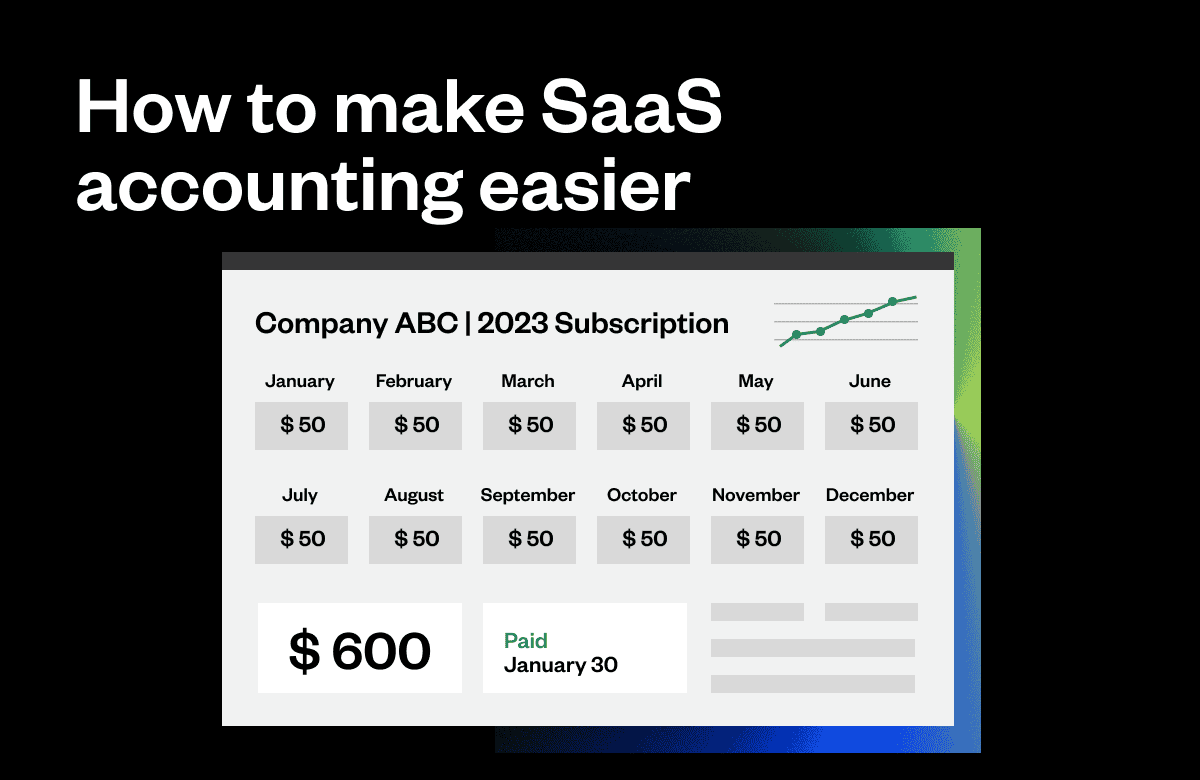
1. Monthly recurring revenue (MRR)
Monthly recurring revenue (MRR) measures the predictable income your SaaS company earns from active subscriptions each month. It standardizes revenue reporting across different pricing plans, discounts, and billing terms, giving you a consistent view of recurring performance and growth. Tracking this metric over time is critical for businesses with month-to-month commercial models.
- Formula: sum of current monthly fees / number of active customers
- Example: If you have 200 active customers each paying $50 per month, your MRR is $10,000.
- Why it matters: MRR is your baseline for measuring month-over-month growth. Investors look at this number to gauge how stable your revenue stream is, and internal teams use it to set realistic budgets and sales targets.
2. Annual recurring revenue (ARR)
Annual recurring revenue (ARR) measures the total predictable revenue your SaaS business generates from active subscriptions over a 12-month period of time. ARR calculation provides a clear view of long-term growth, retention, and revenue stability, especially for companies with annual or multi-year contracts. This metric will be front-and-center for SaaS businesses that primarily rely on annual.
- Formula: MRR × 12
- Example: If your company earns $10,000 in MRR, your ARR is $120,000.
- Why it matters: ARR gives you the big-picture view that MRR can’t capture. It’s particularly useful when evaluating annual contracts and showing potential investors that your business model can scale year over year.
3. Annual contract value (ACV)
Annual contract value (ACV) measures the average yearly revenue from a customer contract. It normalizes revenue across deals of different lengths, helping you compare customer value, segment performance, and sales efficiency. Businesses with multi-year, ramped contracts may find this metric more useful and forward-looking than ARR.
- Formula: Total contract value ÷ contract length (in years)
- Example: A 2-year contract worth $24,000 results in an ACV of $12,000.
- Why it matters: ACV helps you compare deals of different sizes and lengths on equal footing. Sales teams use this to prioritize high-value opportunities, and finance teams rely on it for accurate revenue projections.
4. Expansion revenue
Expansion revenue is the additional recurring revenue generated from existing customers through upgrades, add-ons, or expanded usage. It reflects how well your business grows customer value over time and reduces reliance on acquiring new customers for revenue growth. Understanding Expansion Revenue is important to understanding movements in your Net Revenue Retention rate, a SaaS metric we will cover later in this post.
- Formula: Revenue from existing customers at the end of a period – revenue from those same customers at the start of the period
- Example: If a customer paid $1,000 per month at the start of the year and now pays $1,300 after upgrading, the expansion revenue is $300.
- Why it matters: Growing revenue from your existing base costs less than chasing new customers. High expansion revenue indicates that customers see ongoing value in your SaaS product, which often correlates with lower churn rates.
5. Gross margin
Gross margin measures how efficiently your SaaS business delivers its product or service after accounting for direct costs. It represents the percentage of revenue that remains once expenses like hosting, support, and third-party tools are subtracted, showing how much you keep as profit from sales. This P&L metric is applicable to all businesses – SaaS included.
- Formula: (Total revenue – cost of goods sold) ÷ total revenue × 100
- Example: If your company earns $200,000 in revenue and has $50,000 in costs, your gross margin is 75%.
- Why it matters: This percentage tells you how much room you have to invest in growth. A margin below 70% might signal that your infrastructure costs are eating into profits, while margins above 80% suggest efficient operations.
6. Payback period (CAC payback period)
Payback period (CAC payback period) measures how long it takes for a new customer to generate enough revenue to cover the cost of acquiring them. It shows how quickly your company recoups its marketing and sales investments and begins earning profit from new customers. Investors view this metric as a way to evaluate whether a business has a sustainable commercial model that supports a profitable business long-term.
- Formula: Customer acquisition cost ÷ monthly recurring revenue per customer
- Example: If your average CAC is $1,200 and each customer brings in $200 in MRR, your payback period is six months.
- Why it matters: The faster you recover acquisition costs, the sooner you can reinvest that cash into more growth. While under 12 months remains the goal for top-performing SaaS companies, the median payback period has risen to around 18 months in 2026 as paid acquisition costs have increased (OpenView SaaS Benchmarks 2026, via Digital Applied). If your payback period is trending above 18 months, it’s a signal to revisit your acquisition strategy or pricing
Customer value and retention metrics
The following customer value and retention metrics show how well your business attracts and retains customer relationships. Tracking them helps you understand satisfaction, loyalty, and the long-term value each customer brings to your company.
7. Customer retention rate
SaaS customer retention rate measures the percentage of customers your business keeps over a specific period. It shows how well you maintain long-term relationships and deliver ongoing value that encourages renewals or continued subscriptions.
- Formula: ((Customers at end of period – new customers acquired) ÷ customers at start of period) × 100
- Example: If you start the quarter with 500 customers, gain 100 new ones, and end with 550, your retention rate is 90%.
- Why it matters: Retention is cheaper than acquisition. When customers stick around, you’re building a stable revenue foundation that compounds over time. Retention rates above 85% are common in healthy SaaS businesses.
8. Churn rate
Churn rate measures how much business your company loses over a set period. It helps you understand customer satisfaction, product fit, and overall revenue stability. As far as non-P&L metrics go, this (along with NRR, MRR, ARR, or ACV) is one of the most critical metrics in understanding the health of a business’s overall revenue base for operators and investors alike.
There are several types of churn rates worth tracking:
Customer churn rate
Customer churn rate measures the percentage of customers who cancel or stop using your service within a specific timeframe. It’s one of the clearest indicators of retention and customer experience. Most SaaS companies report churn between 5% and 7%.
- Formula: (Customers lost ÷ customers at start of period) × 100
- Example: If you start with 400 customers and lose 20, your churn rate is 5%.
- Why it matters: Every churned customer represents lost revenue and wasted acquisition costs. Tracking churn by customer segment or product tier helps you identify where the experience is breaking down and where to focus retention efforts.
Revenue churn rate
Revenue churn rate tracks the percentage of recurring revenue lost, excluding new revenue gained in the same period.
- Formula: (Previous revenue – current revenue) ÷ previous revenue × 100
- Example: If revenue drops from $100,000 to $90,000, your revenue churn is 10%.
- Why it matters: Losing a $10,000/month enterprise customer has a very different impact than losing ten $100/month accounts. Revenue churn shows you the actual financial damage from customer losses, which often matters more than counting churned accounts alone.
Recurring revenue churn (ARR/MRR)
Recurring revenue churn focuses on recurring income, showing how much MRR or ARR is lost through cancellations or downgrades.
- Formula: Churned MRR ÷ previous month’s MRR × 100
- Example: If MRR decreases from $10,000 to $9,000, your churn rate is 10%.
- Why it matters: This metric isolates the health of your subscription base. If recurring revenue churn stays below 5% monthly, your business can grow sustainably. Anything above 10% demands immediate attention to customer success and product quality.
9. Net revenue retention (NRR)
Net revenue retention (NRR) measures how much recurring revenue you retain from existing customers over a given period, including upgrades, downgrades, and churn. It reflects the net impact of customer expansion and contraction without factoring in new customer revenue. Put simply, it answers the question of “what will $100 from a customer today likely be 12 months from now? A high NRR signals a business with both a healthy revenue base and an ability to “land and expand” within new accounts.
- Formula: ((Starting MRR + expansion MRR – churned MRR – contraction MRR) ÷ starting MRR) × 100
- Example: If you start the month with $100,000 in MRR, add $15,000 from expansions, and lose $10,000 from churn and downgrades, your NRR is 105%.
- Why it matters: NRR shows how well your business grows revenue from its existing customer base. A rate above 100% means your current customers are driving net growth, while a rate below 100% signals revenue loss that needs to be addressed through retention or expansion efforts. In 2026, the median NRR has compressed to around 101%, meaning simply crossing 100% is no longer a differentiator (G-Squared Partners, SaaS Benchmarks 2026). Top-performing SaaS companies now target 110% or higher, with the best achieving 120%+, and companies in that top quartile grow 2.3x faster than peers sitting at 95–100% (KeyBanc Capital Markets SaaS Survey 2026, via Digital Applied).
When comparing gross retention vs. net retention, remember that gross retention only measures how much recurring revenue you keep after churn and downgrades, ignoring any expansion. Net retention includes upsells and cross-sells, giving a fuller picture of how existing customers contribute to overall growth.
10. Customer lifetime value (CLV or LTV)
Customer lifetime value (CLV or LTV) measures the total revenue your business can expect to earn from a customer over the entire duration of their relationship. It helps you understand long-term profitability and determine how much you can spend to acquire and retain customers.
- Formula: Average revenue per account × gross margin × average customer lifespan
- Example: If a customer generates $1,000 per year, with a 70% gross margin and an average lifespan of 3 years, their LTV is $2,100.
- Why it matters: LTV sets your acquisition budget ceiling. If you know a customer is worth $2,100 over three years, you can justify spending more upfront to win them. Comparing LTV across customer segments also reveals which types of accounts deliver the best returns.
11. Renewal rate
SaaS renewal rate measures the percentage of customers who renew their subscription or contract at the end of a term. It reflects how well your product meets customer needs and how effectively your team maintains long-term relationships. This metric drives NRR, and is a more practical metric for setting goals for your teams that drive renewals, as it is truly only measuring what is actually renewing in the period – not the entire base.
- Formula: (Number of customers who renewed ÷ number of customers up for renewal) × 100
- Example: If 180 out of 200 customers renew their contracts, your renewal rate is 90%.
- Why it matters: Renewals are your earliest warning system for product-market fit issues. If customers aren’t renewing, it’s a clear signal that something isn’t working. Strong renewal rates (above 85%) indicate that your product delivers consistent value that customers want to pay for again.
Many companies use renewal management software to track upcoming renewals and proactively address at-risk accounts before they churn.
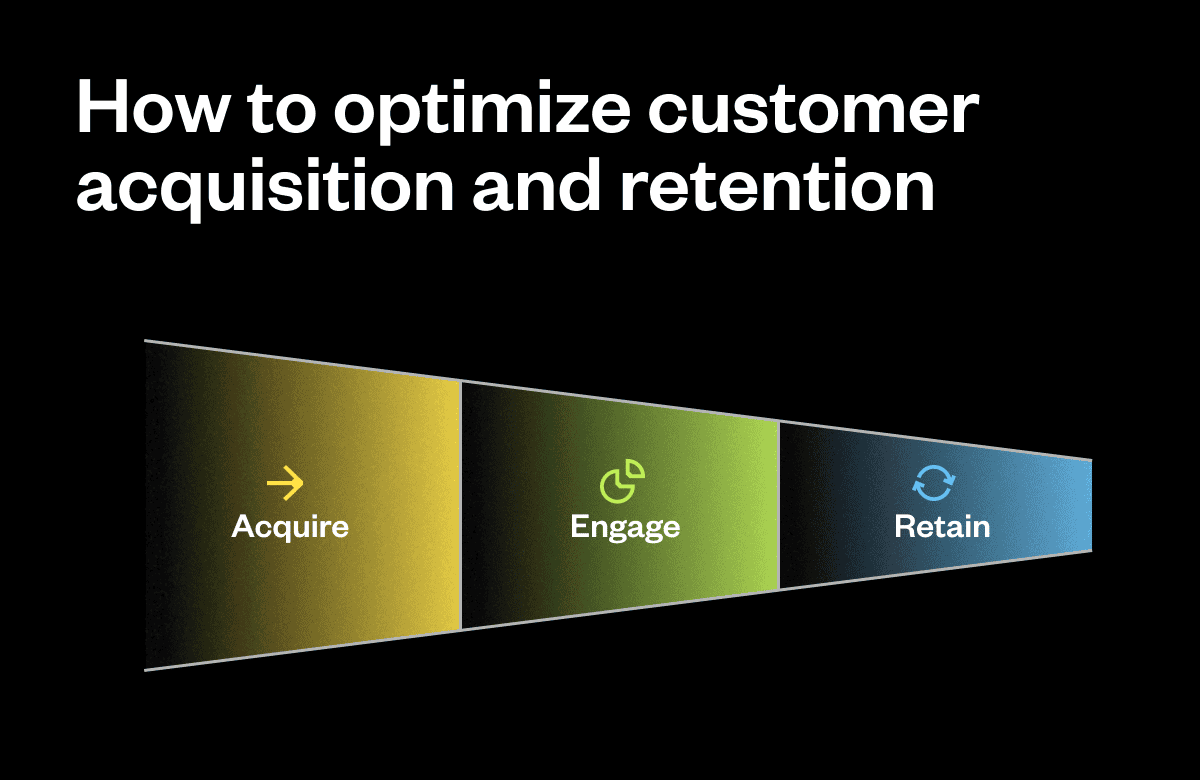
Acquisition and satisfaction metrics
The following acquisition and satisfaction metrics show how effectively your business attracts new customers and keeps them happy. Tracking these helps you evaluate the efficiency of your marketing and sales efforts while understanding how satisfied customers are after they join.
12. Activation rate
Activation rate measures the percentage of new users who complete a key action that indicates they’ve experienced the core value of your product. It helps you understand how effectively you onboard customers and move them from sign-up to engagement.
- Formula: (Activated users ÷ total new users) × 100
- Example: If 500 new users sign up in a month and 300 complete an activation milestone, your activation rate is 60%.
- Why it matters: Users who never activate rarely become paying customers. Tracking activation helps you spot where onboarding friction occurs and which features drive early engagement. Improving activation by even 10% can significantly boost long-term retention.
13. Customer acquisition cost (CAC)
Customer acquisition cost (CAC) measures how much your business spends to acquire a new customer. It includes marketing, sales, and related expenses and helps evaluate how efficiently your company turns qualified leads into paying customers. This is the key building block for calculating CAC Payback and CAC ratio.
- Formula: (Total sales and marketing costs ÷ number of new customers acquired)
- Example: If your company spends $50,000 on marketing and sales in a quarter and gains 250 new customers, your CAC is $200.
- Why it matters: CAC tells you whether your growth is sustainable. If you’re spending $500 to acquire customers who only generate $300 in lifetime value, you’re losing money on every sale. Successful SaaS companies try to maintain a CAC to LTV ratio of at least 1:3.
14. CAC ratio
CAC ratio measures how efficiently your company turns customer acquisition costs into recurring revenue. It compares the cost of gaining new customers to the revenue they generate, showing how sustainable your growth strategy is. This metric isn’t just valuable for measuring historical efficiency; it is a great metric to check future budgets and forecasts against to ensure you aren’t setting targets that indicate overinvestment in GTM spend or underperformance on new bookings.
- Formula: (New recurring revenue for the period ÷ total sales and marketing spend)
- Example: If you spend $100,000 on sales and marketing in a quarter and generate $40,000 in new recurring revenue, your CAC ratio is 0.4.
- Why it matters: A CAC ratio between 0.5 and 1.0 indicates healthy, efficient growth. Ratios below 0.5 mean you’re spending too much relative to the revenue coming in. Ratios above 1.0 signal very efficient acquisition, which might mean you have room to invest more in growth.
15. Net promoter score (NPS)
Net Promoter Score (NPS) measures customer satisfaction and loyalty by asking how likely users are to recommend your product or service to others. It helps you gauge overall sentiment and identify opportunities to improve the customer experience.
- Formula: % Promoters (scores 9-10) – % Detractors (scores 0-6)
- Example: If 60% of respondents are Promoters and 20% are Detractors, your NPS is 40.
- Why it matters: NPS gives you a pulse check on customer sentiment that often predicts churn before it happens. Scores above 50 are considered excellent in SaaS, while anything below 0 signals serious problems with product satisfaction or customer support.
How these SaaS metrics impact your business
Understanding and tracking important metrics is about more than reporting numbers. These insights guide smarter decisions across every part of your business, from pricing and retention to marketing performance and financial planning.
Pricing strategy
Tracking ACV, LTV, and gross margin reveals which plans perform well and which need adjustment. This data helps you refine pricing models and test changes based on real revenue patterns rather than assumptions.
Retention and customer experience
Churn rate and NPS show how customers feel about your product and where they’re leaving. These numbers indicate whether issues stem from onboarding, support, or product fit. Addressing them early keeps customers longer and stabilizes recurring revenue.
Marketing and sales efficiency
CAC and payback period measure how efficiently your company turns prospects into paying users. Comparing these to revenue growth uncovers which acquisition efforts actually pay off, helping teams focus spend on what drives the strongest returns.
Financial forecasting and planning
MRR, ARR, and NRR provide a dependable view of recurring income and future performance. They clarify how upgrades, renewals, and churn affect growth, allowing leadership to plan budgets and product investments more confidently.
How to improve your SaaS metrics
Improving SaaS metrics starts with knowing what drives them. The goal is to build habits and systems that make your data more reliable and your decisions more effective.
- Review metrics regularly: Use SaaS reporting tools to check performance each month. Regular analysis helps you respond quickly and address problems before they escalate.
- Refine pricing and packaging: Use LTV, ACV, and MRR data to adjust subscription pricing. Test changes that reflect customer behavior and match the value they receive.
- Focus on retention: Keep existing customers engaged through regular check-ins, helpful content, and strong account management. Consistent attention improves renewals and reduces churn.
- Optimize acquisition channels: Analyze CAC and conversion rates to identify which sources bring in quality customers. Shift spending toward channels that deliver steady growth and better payback.
- Automate reporting: Centralize information with automated SaaS dashboards and forecasting tools. This improves accuracy, saves time, and gives your team faster insight into performance.
Improving SaaS metrics is an ongoing process. By tracking, testing, and refining your approach, you create a more predictable and sustainable growth model.
Stay on top of your B2B SaaS metrics with Maxio
Reliable metrics start with consistent calculations. When teams rely on Excel spreadsheets or change formulas without a clear process, accuracy slips fast. Numbers stop lining up, reports lose credibility, and it becomes harder to see how the business is really performing.
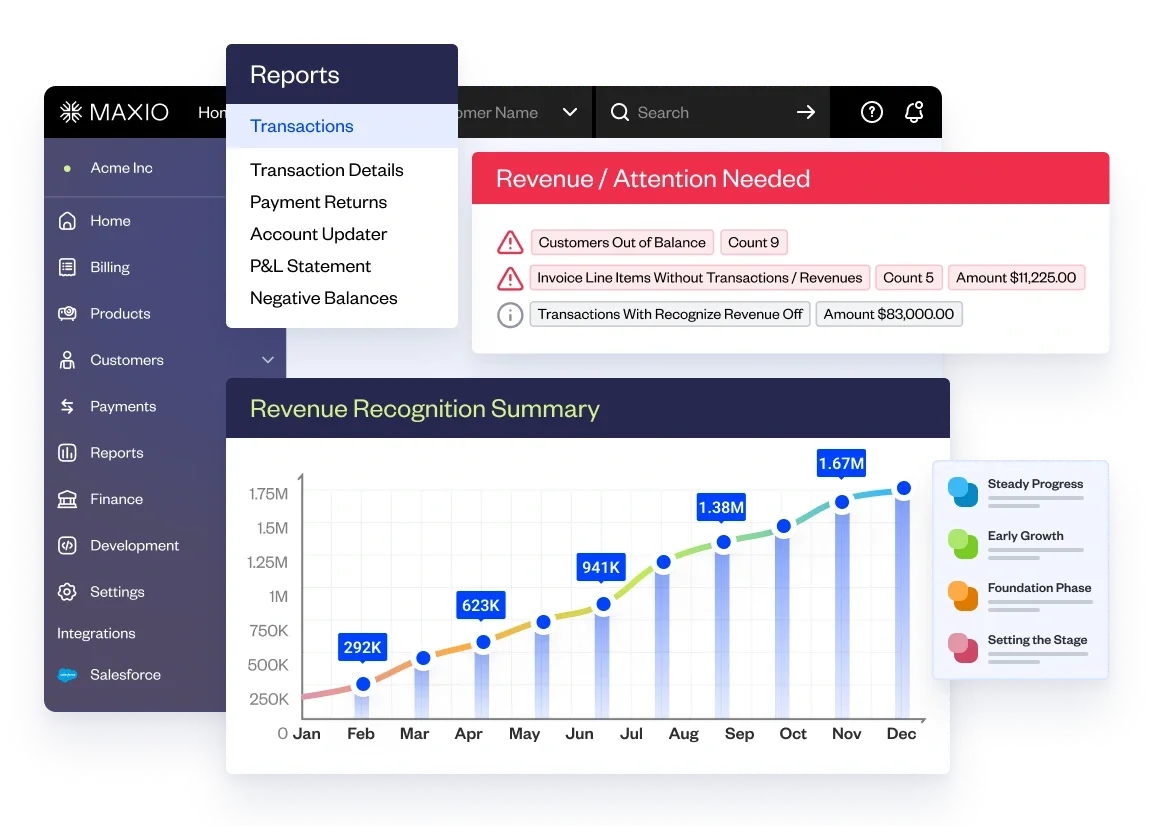
At Maxio, we’re equipped to manage the ins and outs specific to the SaaS industry: revenue recognition, subscription billing, subscription management, metrics & analytics, CPQ, and more. With the power to calculate 100 SaaS finance and analytical metrics at the touch of a button, we make sure you have the numbers you need when you need them.
If you’re interested in crunching your numbers, download our metrics template to get started with your calculations. If you’d like to learn more about how the Maxio platform can help you manage your business more effectively, reach out to get a demo of our platform for free and see how we can help your business grow.
A note on our data: The benchmark figures in this article were last reviewed and updated in May 2026
Get Your Free SaaS Metrics Template
Template provides you with a comprehensive set of pre-built SaaS metrics (that you can trust) to wow investors and make key business decisions with confidence
FAQS
What is the most important metric for SaaS?
Every SaaS metric helps explain performance, but ARR is often considered the most important. It shows how much predictable revenue your business earns each year and gives a clear picture of growth and stability over time.
Keep track of ARR and other key SaaS metrics with our metrics template.
What is the Rule of 40 in SaaS?
The Rule of 40 is a benchmark used to evaluate a SaaS company’s balance between growth and profitability. It states that a company’s revenue growth rate plus profit margin should equal or exceed 40%. Hitting this mark suggests efficient operations and sustainable growth, which often leads to stronger valuations.
Why should SaaS companies use a metrics dashboard?
SaaS companies should use a metrics dashboard to keep all key performance data in one place. A centralized dashboard gives teams real-time visibility into revenue, churn, retention, and other core metrics without switching between tools or spreadsheets.
It also helps leaders make data-driven decisions and stay aligned on goals across departments. Over time, this consistency improves accuracy, accountability, and overall business performance.
How do lifecycle metrics help SaaS companies grow?
Lifecycle metrics show how customers interact with your product over time. They highlight where users find value, where they lose interest, and when they’re most likely to renew or upgrade.
Understanding these patterns allows teams to improve onboarding and build steadier revenue growth.