
In the early days of a SaaS business, organizing your chart of accounts probably isn’t top of mind.
It’s easy for things like accounting practices to take a backseat to other, more exciting things, like the vision and the product.
But as your business grows, neglecting your accounting practices will have negative effects. From closing the books to preparing for an audit to calculating and presenting key SaaS metrics, General Ledger hygiene is essential.
While popular general ledgers such as QuickBooks and Xero offer chart of accounts templates, they often don’t work well for SaaS businesses.
The following will walk you through how to create a chart of accounts for a SaaS business.
Organize By Summary Level For Maximum Comparability
One of the main challenges of setting up a chart of accounts is knowing how detailed you need your financial reporting to be.
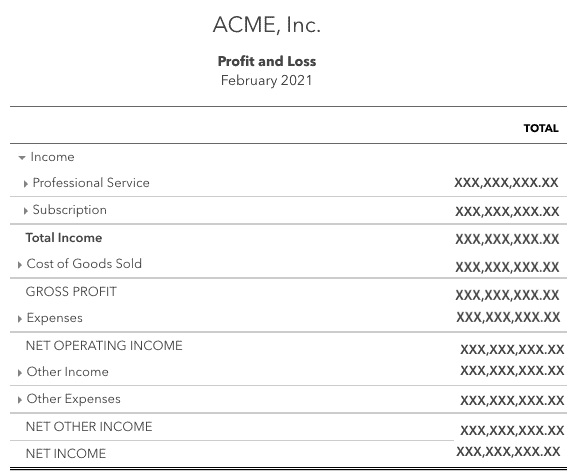
Odds are, your investors will want to see a high-level, summary version of your P&L statement.
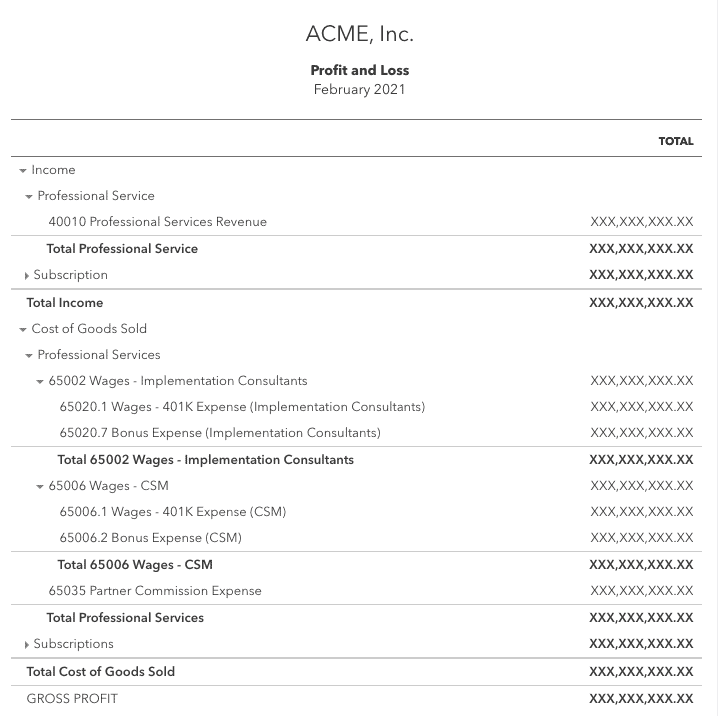
But when it comes to financial audits and making operational decisions for the business, a greater level of detail is required. Here are a few areas you definitely don’t want to skimp on:
- Revenue
- COGS
- Payroll
- Benefits
- Marketing
Having the ability to zoom in and out is important not only for presenting buttoned-up financial statements but also for understanding how your current state compares to the old.
Leveraging Parent-Child accounts, or Sub-Accounts as some GL’s refer to them, allows you to provide summary-level financials externally while still tracking the detail needed to make operational decisions.
See the example below:
Implement a Numbering System
Believe it or not, there is a formula when it comes to building a chart of accounts. More specifically, a numbering formula.
When you look behind the curtain of most GL systems, the common factor is the starting number for major classifications on a balance sheet.
You might be asking yourself, why number accounts in the first place? I already have my names, and Quickbook gives me default names.
The simple answer is you’re going to grow, and you need to have a way to make your financial statements comparable to those of other companies without having to worry about how a name change might impact the order in which things appear.
Let’s say, for example, you want to track your Sales and Marketing expenses.
Today, you create a GL account called Sales & Marketing expenses and Label it Account 5000.
A year from now, you want to segment Sales from Marketing but still keep the summary group 5000 so you can compare to the past.
You go ahead and create 5100 for Sales and 5200 for Marketing.
Next year, you want to segment marketing into digital ads vs. trade events vs. marketing swag, etc.
By having a systematic numbering system, you give yourself the ability to segment and get more details down the road, without losing comparability to the past.
| Today | 1 Year | 2 Years |
| 5000 – Sales & Mktg | 5000 – Sales & Mktg | 5000 – Sales & Mktg |
| 5100 – Sales | 5100 – Sales | |
| 5200 – Marketing | 5200 – Marketing | |
| 5210 – Ads | ||
| 5210 – Trade | ||
| 5210 – Swag |
You may be asking yourself, what is the numbering system I should use?
Thankfully, we know and can help you get started.
The key thing to remember is the first number. That dictates which major balance sheet group it will appear in:
1 – Asset
2 – Liability
3 – Equity
4 – Revenue
5 – COGS (what costs are associated directly with Revenue ( i.e. you wouldn’t incur these costs if you didn’t provide or sell an item).
6 – OPEX
7 – Other Income
8 – Other Expense
9 – the Wild West
9 and up are the wild west because 1 through 8 is all you really need to have a complete and organized number system.
If you’ve been an auditor you know once you see 8 or 9, you enter into the realm of “Other” expenses and that can mean anything.
Focus on nailing 1 through 7 and the major categories you want to track within each, and you’ll be well on your way to having a best-in-class chart of accounts.