
Whether you’re raising your first institutional round of funding or you’re looking to retain funding from an investor, there are specific revenue growth metrics and KPIs that investors expect their portfolios to produce. Not only do these metrics help support the story you’re telling investors about the business, but they are the cornerstone of key operational insights that can help drive your business forward. Today, investors are looking closely at their portfolio companies to ensure sustainability and strategize ways to help them grow. That’s why we partnered with Fulcrum Equity Partners to create a comprehensive guide to SaaS KPIs and important metrics like churn, MRR, ARR, lead generation, and upsell revenue.
Tracking these metrics provides a really insightful view of a company’s business model, sales efficiency, and customer validation. Ultimately, it delivers investors with the key information needed to build conviction during a fundraising process.”
-Chad Hooker, VP, Fulcrum Equity Partners
What is a typical revenue growth rate for SaaS companies?
When you sit down to review company metrics with investors and the board, you’ll typically be asked questions regarding new bookings, churn, and cash burn. These leading and lagging indicators are critical for tracking performance over time.
However, what investors really care about is your company’s revenue growth rate. How does the current period’s revenue compare to the previous period’s revenue? How are repeat customers and customer retention factored in? What is your GRR/NRR?
In order to benchmark your company’s performance you’ll need accurate metrics. The 2024 SaaS Benchmarks Report by High Alpha breaks down the median SaaS revenue growth rate as follows:
<$1M: 100% (48-250%)
$1-5M: 50% (20-115%)
$5-20M: 30% (17-59%)
$20-50M: 30% (20-50%)
>$50M: 15% (12-25%)
How to calculate your revenue growth rate
=Here are the steps you can take to calculate your revenue growth rate:
Determine the time period: Decide on the time period for which you want to calculate your revenue growth rate – monthly, quarterly, or annually
Gather the revenue data: Collect the revenue data for the chosen time period from your financial statements, such as income statements or profit and loss statements. You can also pull this data directly from a SaaS metrics platform like Maxio.
Calculate the revenue growth: To calculate your revenue growth rate, use this formula.
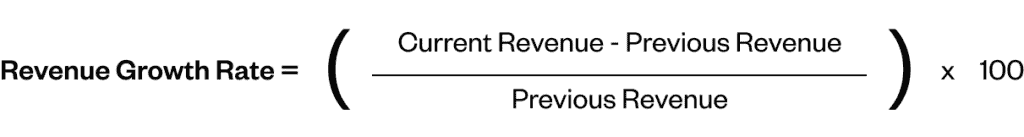
- Subtract your previous revenue from the current revenue in the specified period (monthly, quarterly, yearly)
- Divide the result by your previous revenue
- Multiply the quotient by 100 to express the growth rate as a percentage
For example, if your previous revenue was $100,000 and your current revenue is $150,000, the calculation would be:
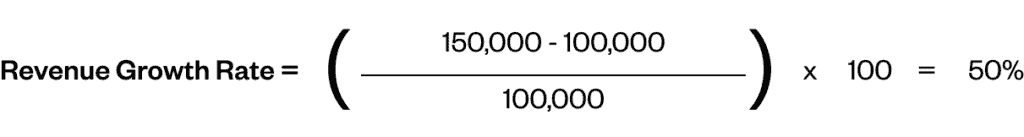
Interpret the result: Once you’ve calculated your revenue growth rate, interpret the result to gain insights into your business’s performance. A positive growth rate indicates your revenue is increasing, while a negative growth rate suggests a decline in revenue. The magnitude of the growth rate reflects the pace of revenue growth, and considering the total amount of revenue will give you a clearer view of your business’s overall financial health.
Analyze and adjust: You can use your revenue growth rate as a key performance indicator to evaluate your business’s performance over time. Compare it with SaaS industry averages or your own historical data to identify trends and patterns.
Consider your business model: If your company makes use of subscription-based services, it is important to factor in the churn rate of your customer base. Churn rate refers to the percentage of customers who cancel their subscription within a given time period. Reducing churn can lead to more revenue and a higher revenue growth rate.
Track conversion rates: To increase revenue growth, it’s important to track conversion rates—the percentage of potential customers who become paying customers. By improving conversion rates, you can increase your customer base and ultimately generate more revenue.
Focus on total revenue: While your revenue growth rate is an important metric, it’s important to also focus on total revenue. A high growth rate may be impressive, but if the total revenue is low, it may not be sustainable in the long run.
By regularly calculating and analyzing your revenue growth rate, you can make informed data-driven decisions and take proactive steps to drive the success of your business.
Top 12 metrics for tracking revenue
Understanding your company’s revenue is more than just looking at topline numbers. These core metrics give investors and internal teams a clearer view of how well your business is performing—and where to further streamline efforts.
Revenue metrics
1. Monthly recurring revenue (MRR) & annual recurring revenue (ARR)
Annual Recurring Revenue (ARR) or Monthly Recurring Revenue (MRR) is the value of the contracted recurring revenue components of your term subscriptions normalized to an annual or one-month period. While an MRR/ARR number is important, it’s the momentum categories that provide true insight. In Maxio’s Subscription Momentum reports, we break ARR/MRR down into the following categories:
- New ARR/MRR: new sales to new customers
- Expansion ARR/MRR: existing customers who expanded their subscriptions or licensed additional products or modules
- Contracted ARR/MRR: existing customers who downgraded their subscription and/or reduced their consumption
- Canceled ARR/MRR: existing customers who canceled their subscription. These components are frequently measured in both absolute value and relative value and are often presented in the context of incremental changes from period to period
One of the most essential metrics investors evaluate is quarter-over-quarter ARR or MRR bookings growth.
How to calculate it:
MRR = (Contract Value ÷ Contract Length in Months)
ARR = MRR × 12
Quarter-over-quarter bookings growth provides valuable insights into the momentum and velocity of the business. Investors consider it to be one of the leading indicators of overall business performance.
2. Average contract value (ACV)
Average Contract Value (ACV) is a measure of the average revenue generated per customer and is usually calculated annually.
A growing or contracting ACV is a good indicator of the value you’re providing customers. This metric is also an important input for your sales and marketing team and provides visibility into how many leads (MQLs) and opportunities (SQLs) are needed to achieve your plan.
How to calculate it:
ACV = Total Contract Value ÷ Number of Contracts
Tracking ACV over time is valuable to understand evolving customer behaviors. It helps drive decision-making for sales and marketing, customer success and retention, as well as your product roadmap.
3. Conversion rate
Conversion rate tracks how well you’re turning leads into paying customers. Depending on your funnel, you may measure multiple conversion points, like from visitor to trial user, or from SQL (sales qualified lead) to closed deal.
A low conversion rate can highlight issues with your sales process or product-market fit. A healthy conversion rate means your outreach and onboarding are working effectively.
How to calculate it:
Conversion Rate (%) = (Number of Conversions ÷ Total Leads or Visitors) × 100
Monitoring conversion rates across different stages helps you spot friction points and improve overall efficiency in your sales and marketing efforts.
4. Profit margin
Profit margin tells you how much money you keep after covering costs. In SaaS, gross margin (revenue minus cost of goods sold) is often the key focus. It shows how scalable your model is.
How to calculate it:
Gross Profit Margin (%) = [(Revenue – Cost of Goods Sold) ÷ Revenue] × 100
Most SaaS companies aim for margins above 70%. If your margin is lower, it might be time to evaluate hosting costs, support spend, or service delivery models.
Investors use this metric to assess whether your company can grow without significantly increasing costs, and if your model is built to deliver long-term value and improve the bottom line.
Customer-centric metrics
5. Customer acquisition cost (CAC)
Customer Acquisition Cost, or “CAC,” helps you make important decisions about allocating sales and marketing spend. It’s valuable in understanding how much your company is making from each new customer. This includes measuring expenses like marketing campaigns, sales team salaries, ad spend, and tools. It’s a key metric for judging the efficiency of your go-to-market strategy.
How to calculate it:
CAC = Total Sales and Marketing Spend ÷ Number of New Customers
Note: Calculating CAC can be a very nuanced effort. Depending upon how your business is structured, automatically including all sales and marketing costs in the month they appear can be misleading. We recommend a thoughtful approach here. Start by asking the question, “Is this truly a cost associated with acquiring a new customer, and is this the correct period for this expense?”
When CAC is high without a corresponding rise in customer value, it’s often a sign your acquisition strategy needs adjustment. Tracking CAC over time helps you see whether customer growth is becoming more or less expensive, ensuring that your marketing efforts are driving a higher return on investment.
6. Customer lifetime value (CLV)
Customer Lifetime Value, or CLV, is the total revenue a customer is expected to generate during their time with your company. It helps you understand what each customer is really worth and whether your acquisition costs are paying off.
How to calculate it:
CLV = Average Revenue per Account × Average Customer Lifespan
Pair this with CAC to calculate your CLV:CAC ratio. A healthy SaaS business usually aims for a ratio of at least 3:1. Anything lower might mean you’re overspending on acquisition, while anything much higher could mean you’re leaving growth opportunities on the table.
CLV also helps guide decisions about how much to invest in onboarding and support.
7. Customer churn rate
Churn rate is the percentage of customers who cancel their subscription during a given time period. It’s one of the clearest indicators of customer satisfaction and long-term revenue stability.
How to calculate it:
Customer Churn Rate = (Customers Lost ÷ Customers at Start of Period) × 100
It’s helpful to track both customer churn (number of accounts lost) and revenue churn (MRR or ARR lost), especially if your pricing varies widely across customers during a given period.
Reducing churn often has a bigger impact on revenue than acquiring new customers, especially in high-ACV SaaS models.
8. Customer retention rate
Retention rate shows how many customers stay with you over a period of time. It’s essentially the inverse of churn and is especially important for recurring revenue models.
How to calculate it:
Retention Rate = [(Customers at End of Period – New Customers) ÷ Customers at Start of Period] × 100
High retention means your product continues to deliver value, customers are engaged, and your customer experience is strong, which is key to keeping customers loyal and satisfied. It also sets you up for stronger upsells and long-term growth. Investors often see strong retention as a sign of product-market fit.
Sales metrics
9. Sales pipeline health
A healthy pipeline reflects a steady flow of qualified opportunities at different stages of your sales process. It helps sales leaders and investors gauge whether future revenue targets are realistic based on what’s currently in play.
Key signals of pipeline health include:
- Pipeline coverage ratio (total pipeline value vs. sales target)
- Deal stage distribution (too many deals stuck early in the funnel can signal a bottleneck)
- Aging deals (stalled or overdue opportunities may need follow-up or requalification)
Tracking pipeline health gives early warnings if you’re likely to miss targets, and shows whether your top-of-funnel efforts are strong enough to support future bookings.
10. Sales cycle length
Sales cycle length is the average time it takes to close a deal, from first contact to signed contract. Knowing your sales cycle helps with forecasting, resource planning, and overall sales performance.
How to calculate it:
Sales Cycle Length = Total Days to Close All Deals ÷ Number of Deals
Shorter cycles usually mean more efficient processes or a product that resonates quickly with buyers. Longer cycles may be expected for enterprise deals, but if timelines are slipping or inconsistent, it could point to friction in your process.
Investors look at cycle length to understand how long capital will be tied up before it turns into revenue, and whether your sales team can scale efficiently.
11. Win rate and average deal size
Win rate measures the percentage of deals your team closes out of the total number of qualified opportunities.
How to calculate it:
Win Rate = (Closed Won Deals ÷ Total Qualified Opportunities) × 100
A declining win rate might indicate issues with product fit, pricing, competition, or deal qualification. Improving this metric can often be more cost-effective than generating new leads.
Average deal size is exactly what it sounds like: the average dollar value of your closed deals. Tracking this over time helps you understand the quality of your pipeline and whether your team is moving upmarket, downsizing, or staying consistent.
Together, win rate and deal size help shape realistic sales targets and revenue forecasts.
12. Sales velocity
Sales velocity measures how quickly your team is generating revenue. It combines several other metrics into one formula and gives you a snapshot of how fast deals are moving through the pipeline.
How to calculate it:
Sales Velocity = (Number of Opportunities × Win Rate × Average Deal Size) ÷ Average Sales Cycle Length
Higher velocity means your team is closing more deals, at higher values, in less time. It’s a strong indicator of sales efficiency and team performance.
Velocity is especially useful for spotting slowdowns that might not be visible when looking at metrics in isolation, like more deals entering the pipeline but fewer closing on time.
Use forecasting to optimize revenue operations
Accurate forecasting helps you stay ahead of potential revenue gaps, allocate resources more effectively, and keep investors confident in your growth plan. By using real-time data from your sales pipeline, historical performance, and market trends, you can build revenue forecasts that guide strategic decisions, not just hit-or-miss projections. This becomes especially important as your company scales and needs to plan budgeting and product development around predictable revenue.
Good SaaS forecasting also helps connect sales and operations teams around shared goals. Instead of relying on gut feelings or best-case scenarios, teams can work from a unified view of what’s likely to close, and when. Tools like Maxio can make this easier by pulling from your CRM, billing, and product usage data to create forecasts grounded in real activity. The result is more informed decision-making and a stronger ability to hit your revenue targets quarter after quarter.
Get your free SaaS metrics template
Template provides you with a comprehensive set of pre-built SaaS metrics (that you can trust) to wow investors and make key business decisions with confidence.
Increase revenue and please investors with Maxio
What’s the best way for SaaS leaders to increase their revenue and please investors? The answer is simple: provide more value to customers. By doubling down on customer satisfaction, you’re essentially knocking out two birds with one stone.
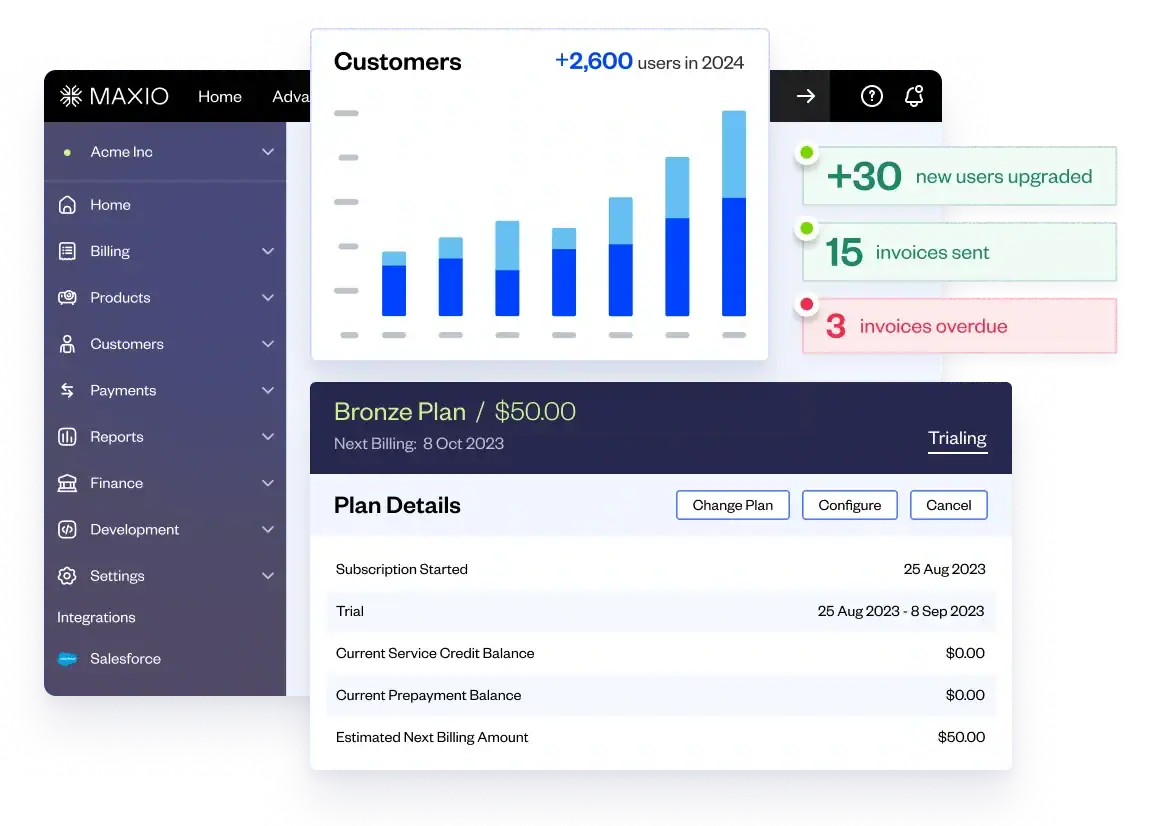
At Maxio, we’ve built a platform to help you do just that. Our SaaS metrics and analytics dashboard helps you see how product lines and business segments are performing across your customer base. You can then use that knowledge to pull the right growth levers in your business, increase revenue, and ultimately get buy-in from investors on your next stage of growth.