This is the fourth year Benchmarkit has published their annual SaaS Performance Metrics Benchmark Report and Interactive Benchmarks (click here). This is the third year that Maxio has partnered with Benchmarkit on this critical set of SaaS benchmarks.
There are several interesting trends we uncovered in this year’s benchmarks:
- Growth rates declined for a third year in a row
- Planned growth rates remain higher than the previous year’s actual growth rates
- New customer acquisition costs continued to increase in 2024
- Net Revenue Retention was flat year over year (‘24 vs ‘23)
- Expansion ARR increased contribution to total New ARR
- ARR per FTE increased a second year in a row
- Sales and Marketing expenses continue to show high correlation to company size
- VC backed companies invest 14% more in S&M (44%) than PE backed companies
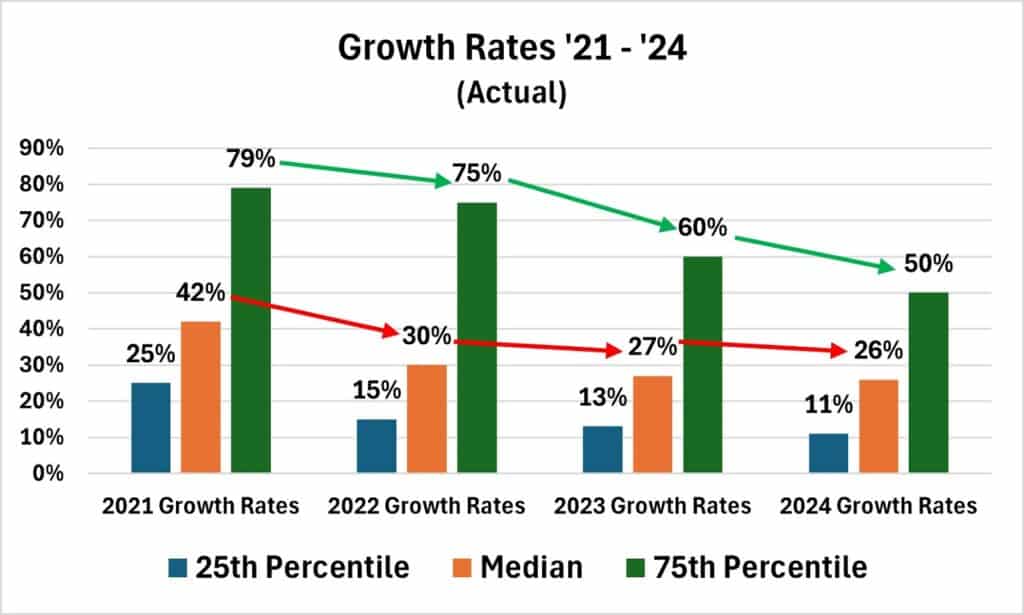
Growth Rates:
Source: Benchmarkit 2025 SaaS Performance Metrics Benchmarks Report
For a third straight year, the B2B SaaS industry experienced declining growth rates at the 25th percentile, median and 75th percentile. Though growth rates only declined 1% at median in 2024, the bar for being in the top quartile of growth declined from 60% in 2023 to 50% in 2024.
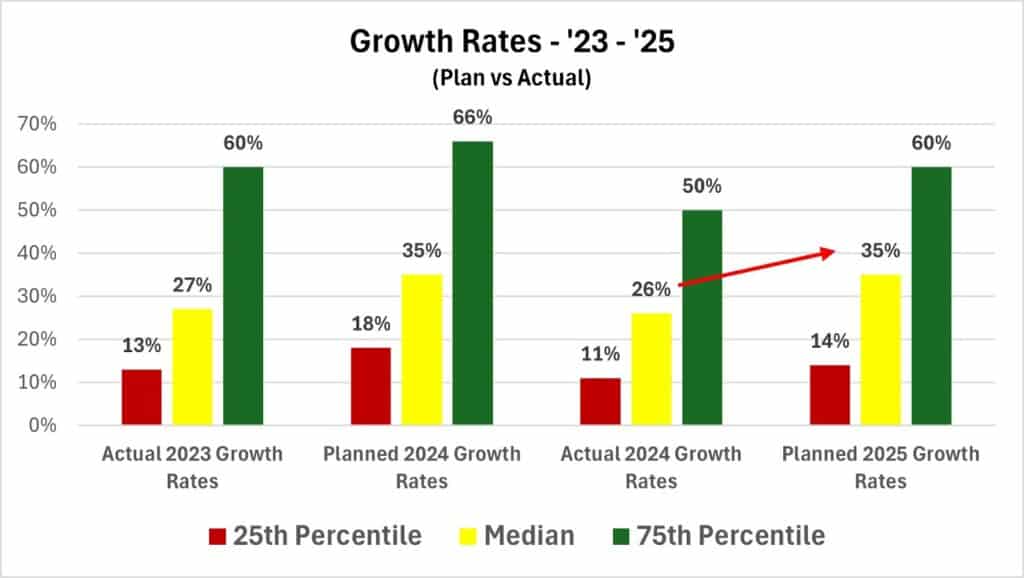
In 2023, we started to track how actual growth rates compared to the next year’s planned growth rates. As you can see from the below chart, B2B SaaS companies plan to grow at 35% in 2025 (median), which is exactly the same planned growth rate B2B SaaS companies planned across the research population in 2024. Unfortunately the median actual growth rate was 26% – nine percentage points lower (-9%) than the planned growth rate for 2024.
If companies are budgeting for higher growth, and maintain the budget required to achieve a higher growth rate – operating profitability and cash burn will continue to suffer.
Actual versus Planned Growth Rates:
Source: Benchmarkit 2025 SaaS Performance Metrics Benchmarks Report
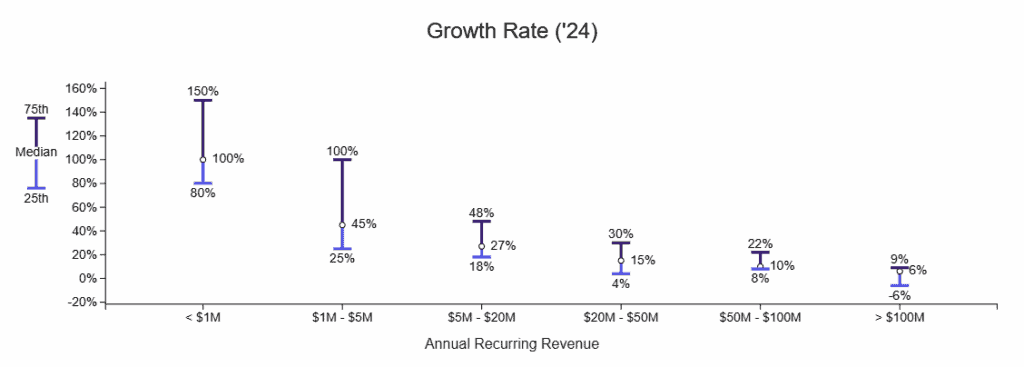
2024 Company Growth Rate – by Annual Revenue:
As B2B SaaS companies grow in revenue size, they experience a reduction in growth rates. As can be seen in the chart below, median growth rates were dramatically lower beginning at $20M ARR, and those growth rates are all below the median growth rates for public SaaS companies, even though they are much larger.
Source: Benchmarkit 2025 SaaS Performance Metrics Benchmarks Report
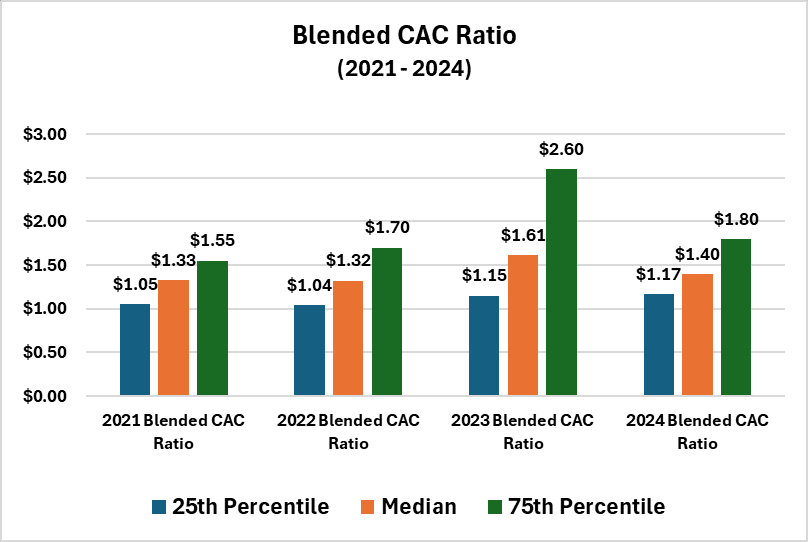
Revenue Growth Efficiency: CAC Ratio Trends
Revenue growth efficiency has been a recurring theme since the second half of 2022. The result of this increased focus on growth efficiency, as measured by the Blended CAC Ratio is mixed at best. The Blended CAC Ratio, which is calculated by dividing the Total Sales and Marketing expenses by the combined new logo ARR and existing customer expansion ARR, decreased to $1.40 in 2024, a 13% decrease – which on the surface seems like a positive.
Blended CAC Ratio:
I was pleasantly surprised when I first saw that Blended CAC Ratio decreased from $1.61 in 2023 to $1.40 in 2024 per the below chart
Source: Benchmarkit 2025 SaaS Performance Metrics Benchmarks Report
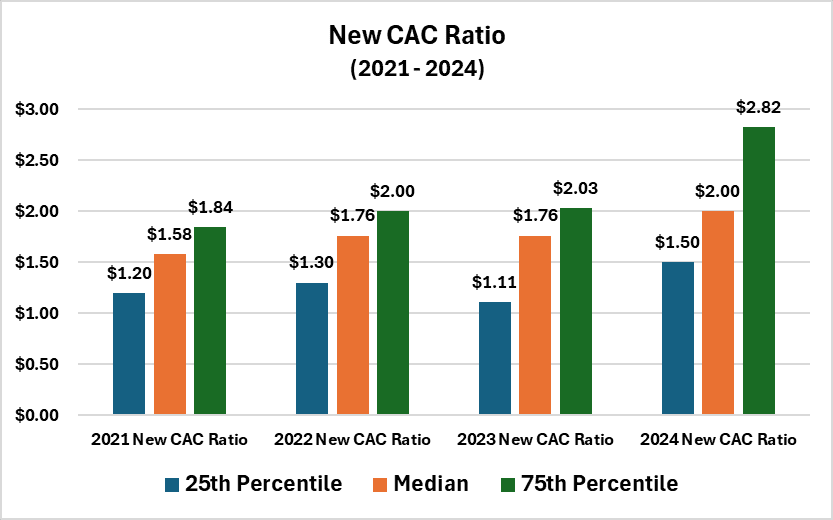
New CAC Ratio:
I quickly pivoted to analyze the New CAC Ratio which is how much Sales and Marketing expense was incurred to generate $1 New ARR from new logo customers. I was hopeful that it too had declined and the path to increased revenue growth efficiency had been achieved in private B2B SaaS companies – though anecdotally, from all the conversations and client SaaS metric’s assessments I conducted in 2024, that did not seem obvious or possible. Let’s see how the New CAC Ratio performed in 2024!?
Source: Benchmarkit 2025 SaaS Performance Metrics Benchmarks Report
As you can see from the above chart, the New CAC Ratio actually increased from $1.76 in 2023 to $2.00 in 2024. Immediately I had two different assumptions on what could have led to a lower Blended CAC Ratio when New CAC Ratio increased, so I quickly went to look at the Expansion CAC Ratio, which measures how much Sales, Marketing and Customer Success expense is incurred to grow $1 in Existing Customer Expansion ARR.
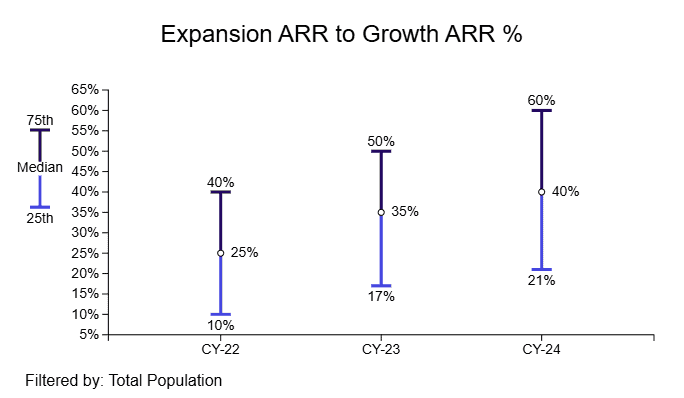
Expansion ARR vs New Logo ARR Trends:
Immediately, I noticed that not only has the dependency on Expansion ARR increased dramatically over the last two years – but at certain stages in a B2B SaaS company’s life it becomes the central component of growth let’s take a look:
Source: Benchmarkit 2025 SaaS Performance Metrics Benchmarks Report
The above chart highlights B2B SaaS companies generate 40% of their Total New ARR from existing customers. This is a material level of increase from the 25% median in 2022, which is close to the traditional wisdom that a 70% New / 30% Expansion ARR mix was standard for companies over $15M – $20M. Let’s take a look at the mix by company size:
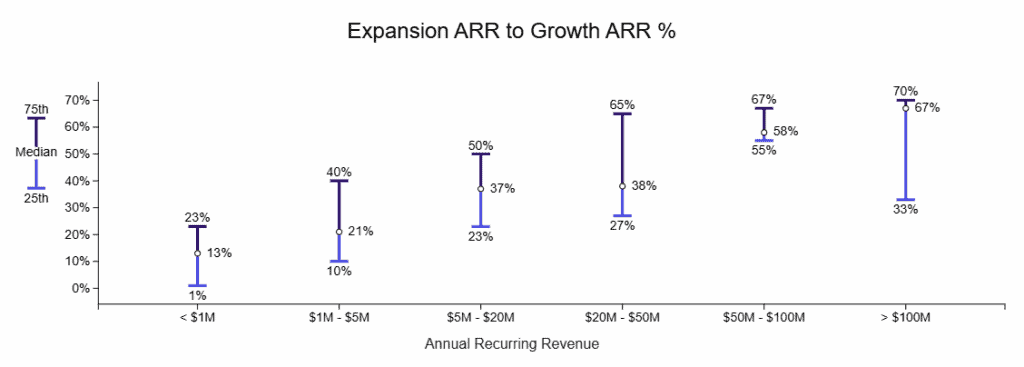
Source: Benchmarkit 2025 SaaS Performance Metrics Benchmarks Report
The above chart clearly highlights that B2B SaaS companies are increasingly dependent on expansion ARR for growth. At the same time, very few B2B SaaS companies apply the same rigor of process, measurement or focus on expansion ARR as they do New logo ARR.
Net Revenue Retention (NRR) trends
Though NRR remained stable year over year, which is an accomplishment compared to 2022 and 2023, it decreased at the 75th percentile, but only by 1% which is immaterial in survey based research.
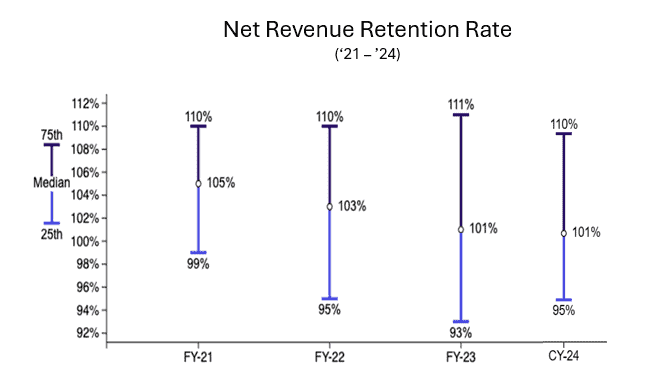
Source: Benchmarkit 2025 SaaS Performance Metrics Benchmarks Report
Even with the additional investments made in existing customer retention and expansion, you can see the overall median for NRR has decreased from 105% (‘21) to 101% (‘24).
There are several strategies that can be experimented with and used to increase expansion ARR including
- New Pricing and/or Packaging
- Creation of near adjacent product add-on modules or applications
- Partnering with near adjacent product add-ons
- Acquisition of near adjacent product add-ons
Capital Efficiency – The key to weathering the “SaaS Turbulence”
Beyond the mantra of “Efficient Revenue Growth”, most investors over the past 10 quarters (30 months) were and are encouraging – OK insisting that their portfolio companies reduce expenses to extend cash runways.
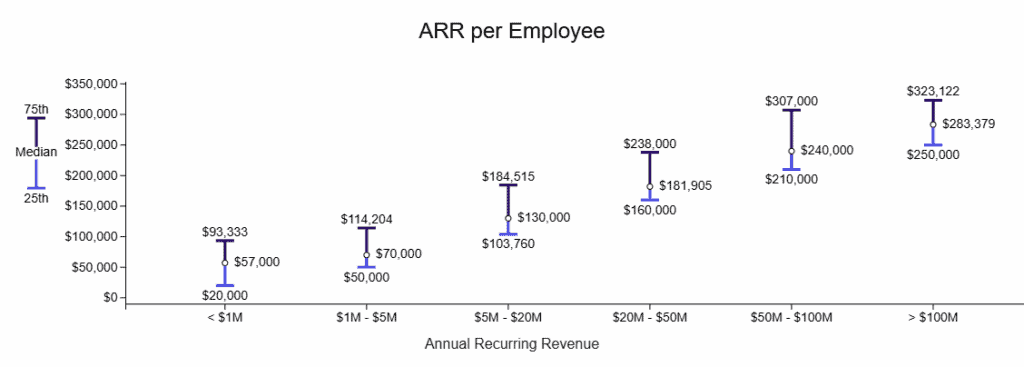
The good news is as a result, we have seen an increase in ARR per Employee benchmarks, segmented by company size in the below chart:
ARR per Employee: 2024
Building upon the positive trends in ARR per FTE, I next wanted to see how Operating Expenses, specifically Sales and Marketing Expenses as a percentage of revenue were trending:
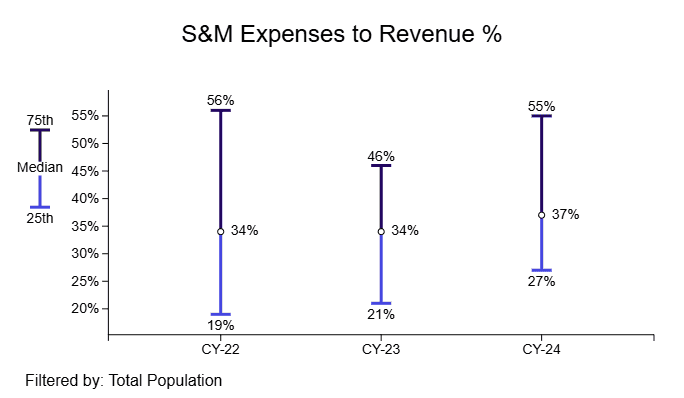
The above chart highlights that as companies planned for higher growth rates in 2024 (35% versus 27% actual growth in 2023), they apparently also modeled in the Sales and Marketing Resources, programs and investments to hit that planned thirty-five percent 2024 Growth Rate.
Historically, as companies scale they become more efficient in growth as measured by Sales and Marketing expenses as a percent of revenue – so let’s take a look at that view for 2024:
Sales and Marketing Expense as a Percentage of Revenue: 2024 by Company Size

Source: Benchmarkit 2025 SaaS Performance Metrics Benchmarks Report
The trend for increased Sales and Marketing efficiency, as measured by total S&M expenses to revenue as companies grow holds true in this year’s findings. In fact, private SaaS companies in the greater that $50M ARR range are spending less (at median) than public SaaS companies, but unfortunately in 2024 that is coupled with growth rates lower than public SaaS companies in the $500M and above size range.
Summary and Conclusion:
So WHAT are my key takeaways from the 2024 B2B SaaS Performance Metrics Benchmarks?
- B2B SaaS companies must treat expansion ARR with the same rigor as New ARR
- New customer ARR continues to be challenged as measured by New CAC Ratio – it is time to start looking for new innovations and approaches for new customer acquisition
- Growth rates at each quartile are challenged and those who find ways to grow in the top quartile will receive outsized valuations
- Expansion ARR is growing in importance, so understanding which ICP represents the best retention measurements (GRR) and expansion opportunities is table stakes for growth
- If a B2B SaaS company’s growth rate is at or below the median (15%) – having a cash burn below zero and and operating profitability that a PE firm can love (> 20%) is a prudent strategy