Business planning at B2B SaaS companies often feels like more art than science. We use models that are built on assumptions on top of other assumptions. And we never really know if the assumptions are right. This is where having reliable data makes all the difference. Having the ability to triangulate your results against a peer group allows you to understand where you are leading or lagging the market, and it directly impacts your ability to do more effective AND efficient business planning.
This year’s B2B SaaS Performance Metrics Benchmarks Report, compiled by Ray Rike and the Benchmarkit team, is an indispensable resource for any B2B SaaS Executive Team. Drawing insights from over 900 companies, it offers a comprehensive view of industry trends and metrics.
This report has been instrumental in guiding our strategic choices at Maxio and helping us gauge our performance each year. The 2024 edition continues this tradition, providing critical insights that reflect the industry’s challenges and opportunities.
As my executive team and I processed the different implications, we thought there were some specific insights with regard to how to think about driving growth and allocating resources that we wanted to share with the broader SaaS community.
Evolving Growth Strategies
Over the past year, the focus has shifted from “growth at all costs” to “efficient growth” and now to “lower growth with reduced efficiency.” This trend has been particularly challenging for companies backed by venture capital or private equity, leading to intense boardroom discussions about adapting to this new reality. Recent industry reports, such as Gartner’s 2023 Global Software Buying Trends and IDC’s Worldwide Website Software Forecast, highlight a slowdown in growth due to economic uncertainty and budget constraints, particularly in the cloud services sector.
When we look at the Benchmarkit report, we see that the key growth efficiency metrics such as Blended CAC, New CAC, and CLTV/CAC are all going in the wrong direction.
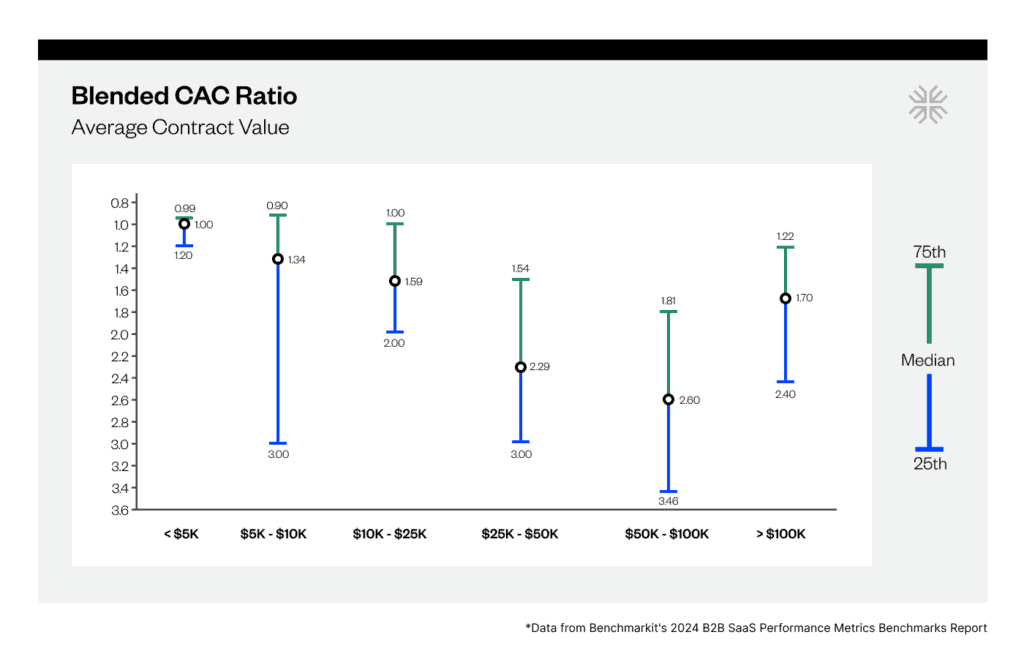
As a metric, Blended CAC is valuable because it provides visibility to all “new” ARR (including new logo and expansion). In my experience, when most people talk about CAC, they use all of Sales and Marketing expenses against just the new logo ARR created during a specific time period. This is problematic because you are not allocating Sales and Marketing spend to your “customer marketing” efforts that help generate “expansion” ARR. This year’s Benchmarkit report shows that there are several “valleys of death” with regard to Blended CAC ratio. The segment of companies between $20-$100M tells the story of what I am hearing from many CEOs–they are trying to mine their customer base. This means focusing more sales and marketing dollars at the install base to drive growth. Two years ago, everyone thought this was the easier play: you have a contract in place, you have a relationship, and you have gotten through procurement. What this year’s report says is that it is getting more expensive to pursue this growth path.
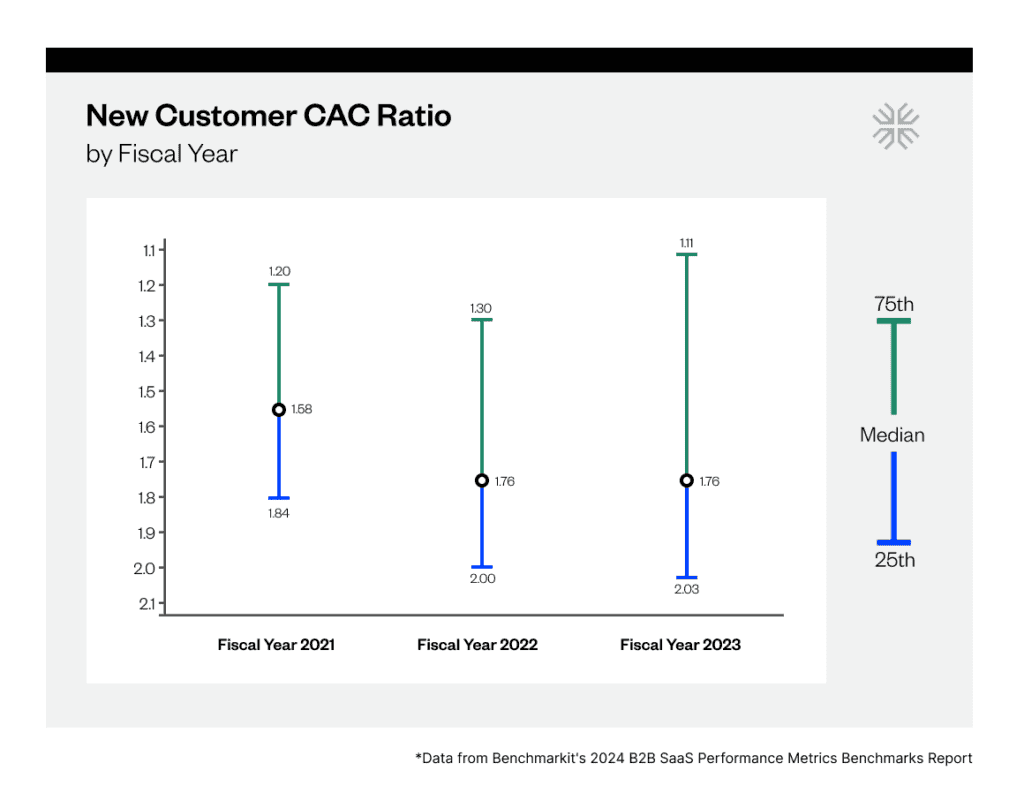
Dan Owens, our CFO, was struck by the latest trends in New Customer CAC, a subset of Blended CAC.
The New Customer CAC Ratio is all about finding the efficient frontier sweet spot. The challenge is dialing in the Go-To-Market investment allocation. The latest trends show that companies are facing increasing headwinds as they focus on closing new business while their prospects are tightening their spending budgets. This ratio requires discipline and cross-functional cooperation to calculate correctly. Specifically, finance teams need to partner with their respective Sales and Marketing functions to understand and accurately capture what investments are dedicated to new versus existing customer base sales. It is also very important to understand the specific sales cycle to properly match S&M spend investment to the corresponding new business to calculate and properly interpret the ratio results. The current business environment requires proactive S&M spend allocation to allow for experimentation to achieve top-quartile results.
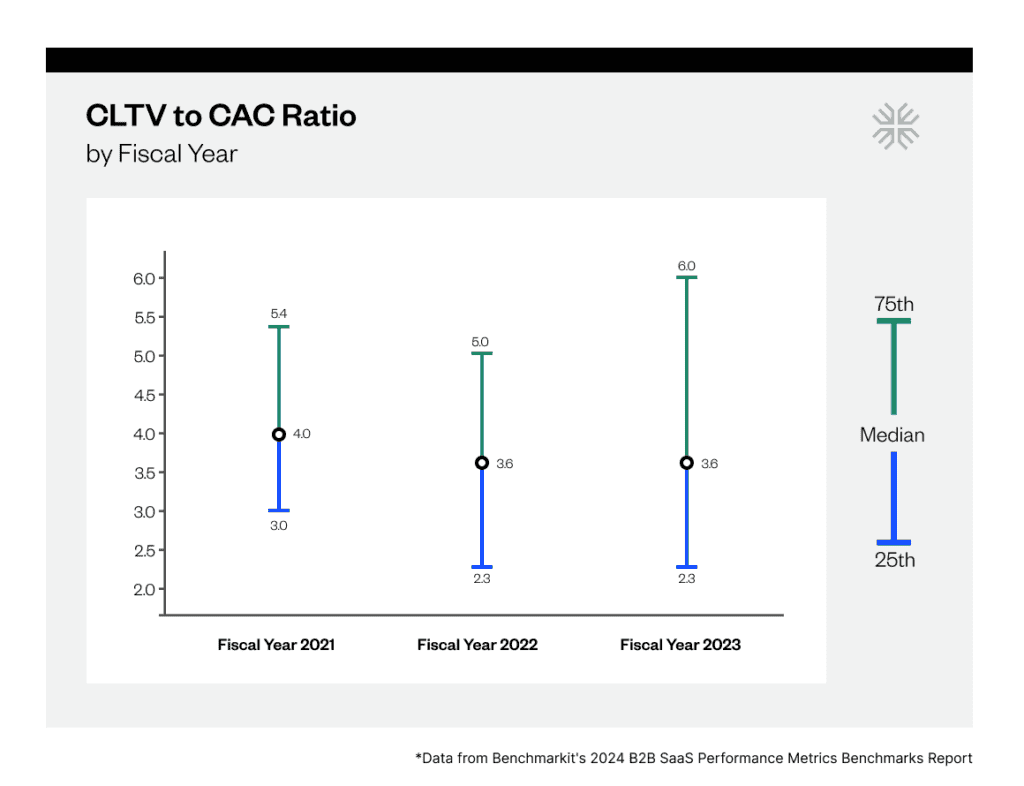
Obviously, growth comes not just from new logo sales, it also comes from install base activation. To that point, our VP of Sales, Will Ibsen noted:
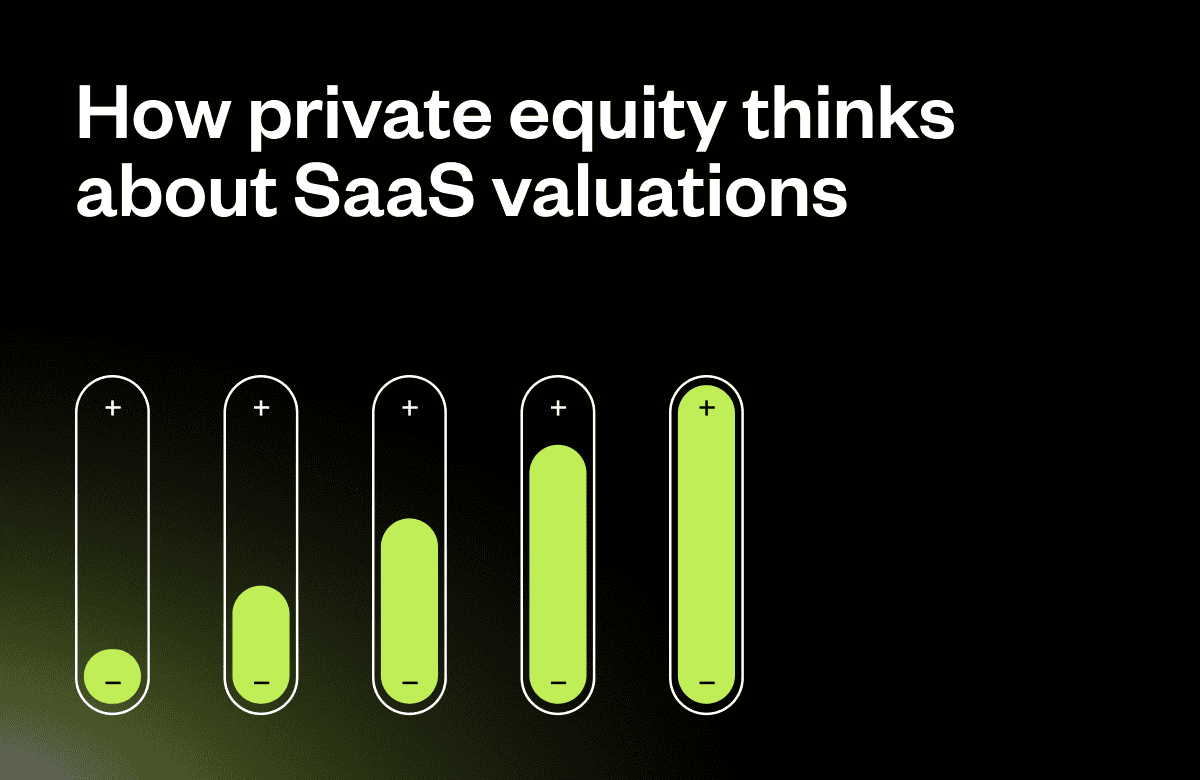
The new report from Benchmarkit revealed that while CLV/CAC ratios for most B2B SaaS companies have remained stagnant for the last two years, some companies are figuring it out with the top percentile boasting 6x ratios.
For that cohort, this means that the revenue from your average customer is 6x higher than what it costs to acquire them. For the others, the cost to acquire customers isn’t getting any cheaper or easier.
So what is the 75th percentile up to? My guess is they are PLG.
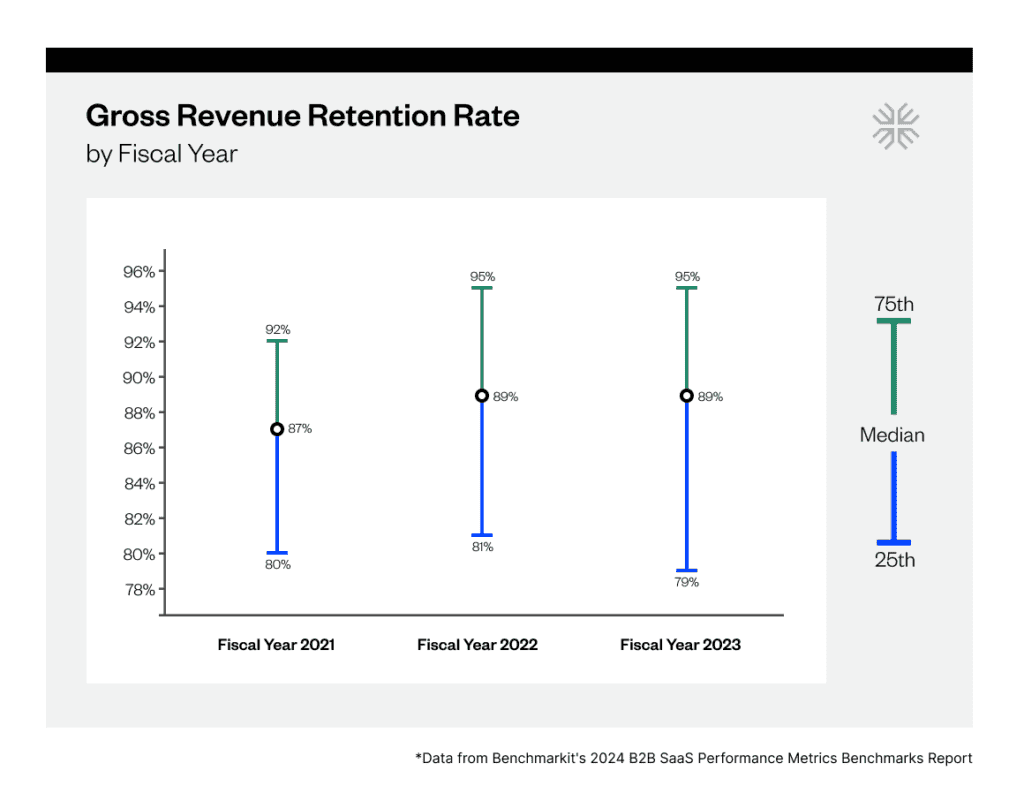
Amidst these challenges in customer acquisition, maintaining strong Gross Revenue Retention (GRR) has never been more critical. Eric Hansen, Head of Customer Success had this to say:
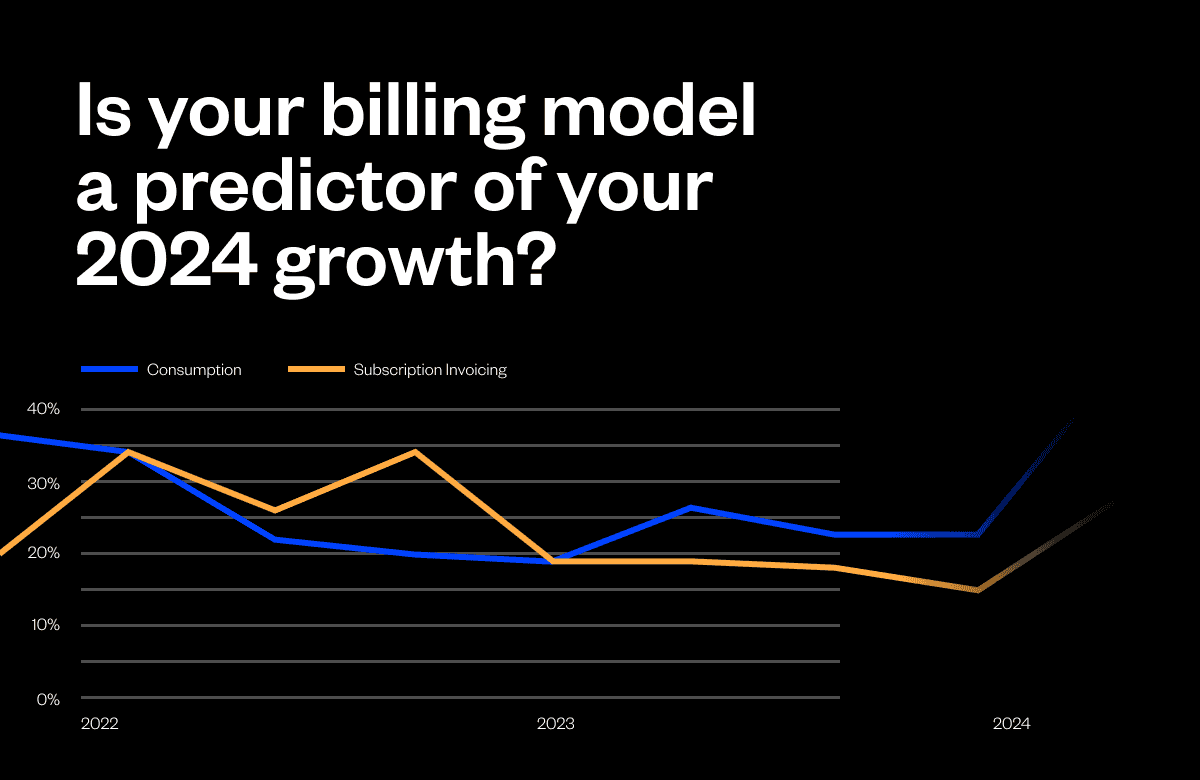
Gross Revenue Retention (GRR) is a key metric in understanding the health and satisfaction of your current customer base and how your existing solutions are working. Depending on your product offerings, pricing, and changing market conditions, your ability to drive extra revenue on top of that or Net Revenue Retention (NRR) may vary. Still, the foundation of the health of your business will depend on your GRR. GRR also becomes more important over time as the percentage of new revenue to existing revenue decreases in ratio for more mature businesses. Often termed “the leaky bucket,” for large companies, the ability to keep a high GRR is an extremely important metric as it gets harder and harder to fill with new sales. In this year’s benchmark, there are a couple of interesting trends, including the drop in the low end of GRR from 81% to 79% over the last year. This indicates that companies with stronger product market fit may be able to retain their historical GRR rates. Still, companies at the bottom are having a harder time keeping customers or executing renewals at a discount in these times of tightening budgets. Usage pricing models also show a lower GRR than subscription contracts, likely due to many subscription contracts being sold on annual or multi-year commitments, with Usage contracts often being month to month. This might be a leading indicator for lower GRR rates in the coming months as longer-duration contracts come due.
Strategic Resource Allocation
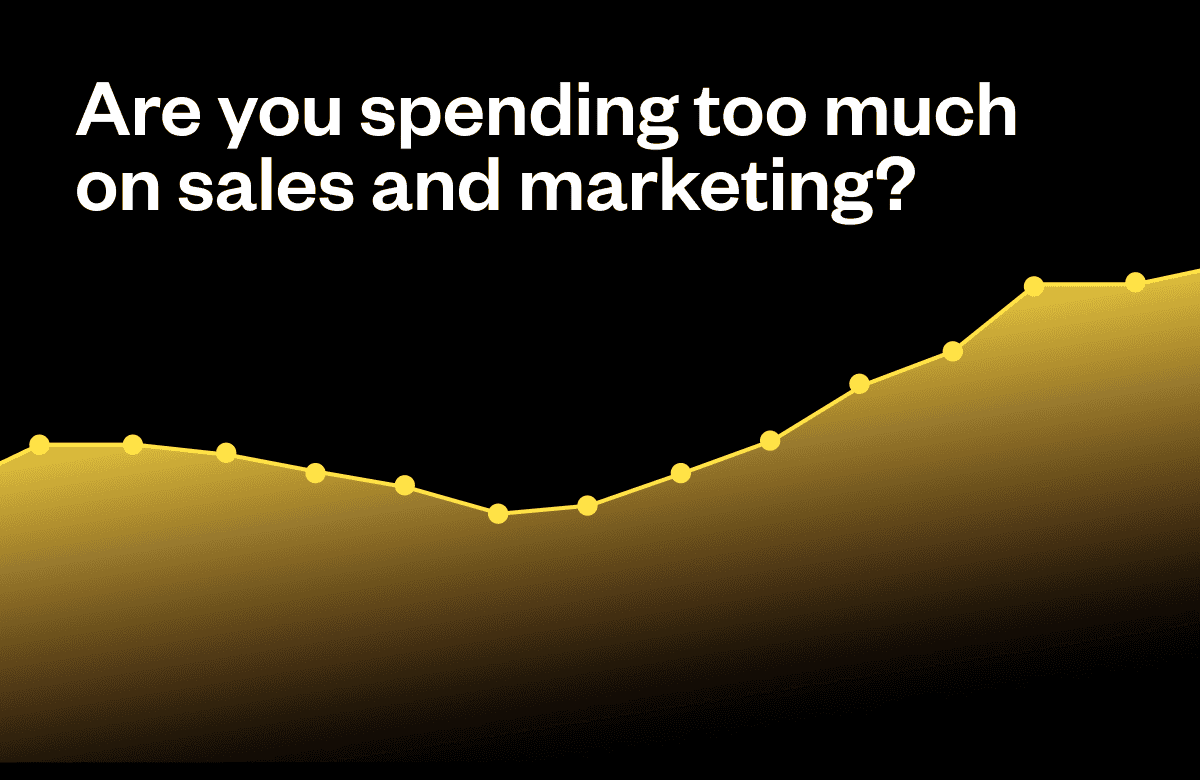
In response to the micro-recession in the B2B SaaS sector, many companies have reduced their Sales and Marketing expenditures. Despite declining growth rates, the increased cost of acquiring incremental growth underscores the need for strategic resource allocation.
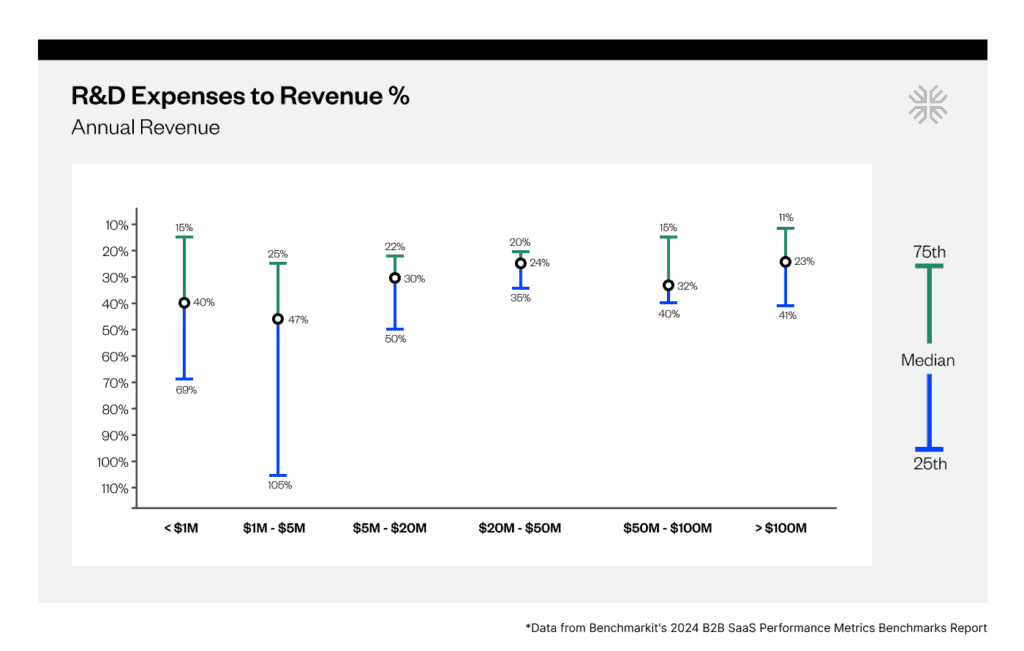
While the report showed a decrease in sales and marketing expenses year-over-year, the median for G&A and R&D stayed relatively the same. Barrow Hamilton, Head of Product, commented:
30% is a typical level I see in the market for R&D Expense as a percentage of Revenue; you can see that in this benchmarking report. If the percentage is significantly higher, it should be allocated as such purposefully. For example, this percentage is typically higher for companies in the sub $5M revenue range as these companies ramp investment to capture market share once they’ve found product-market fit. The report validates this with a range of up to 105% for these companies and a median of R&D expenses approaching half of revenue.
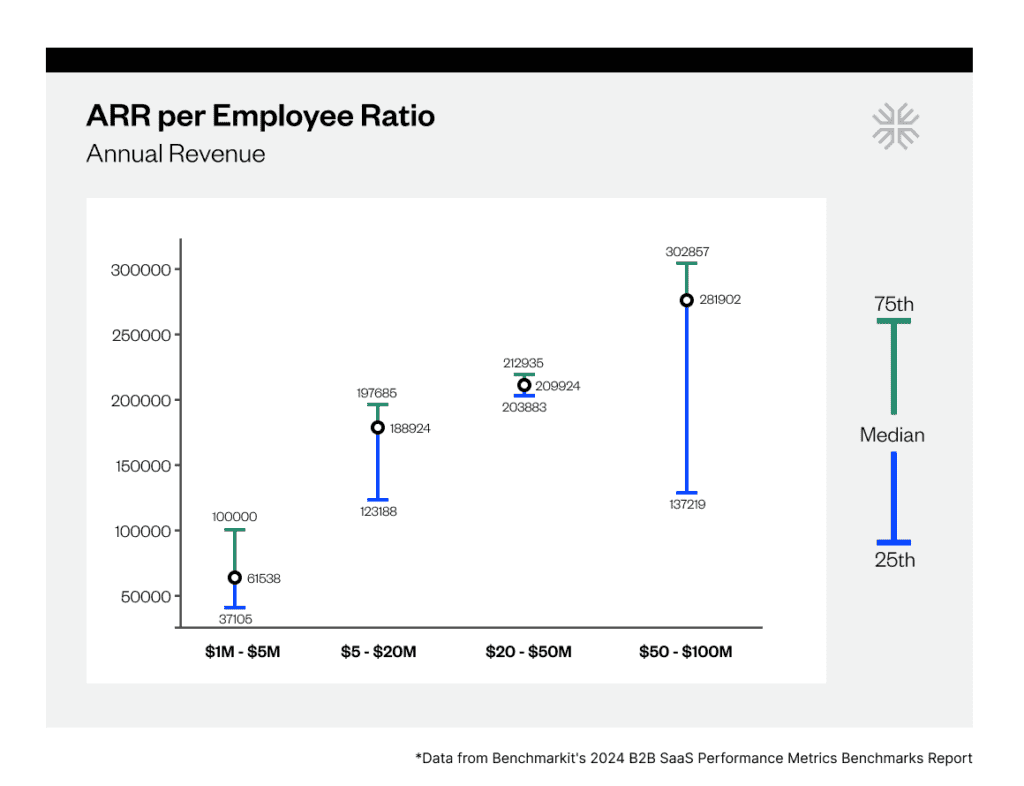
At the end of the day, benchmarks on S&M, G&A, and R&D aggregate a company’s spending across people, tech, partners, and programs. However, nearly 65-75% of spending for most B2B SaaS companies is associated with employee spend. In some ways this is our most strategic resource tradeoff. To that point, Chris Weber, COO, noted the trends associated with ARR/employee:
This year’s report introduces ARR per Employee as a key metric, highlighting its rising importance as the industry focuses on efficient growth in a cautious capital environment. With many companies having reduced their teams over the last 18-24 months, it’ll be interesting to see if they can maintain these efficiencies and boost ARR growth or if they’ll start hiring again. The shift towards AI to enhance employee productivity makes this metric even more relevant. However, since this metric treats all employees the same, from entry-level to seasoned execs, I find ARR per Total Salaries and Benefits a more insightful internal measure for tracking efficiency.
Despite the challenges around driving growth and making those tough resource investment tradeoffs, it is clear that most CEOs–especially those leading companies with more than $1M in ARR–are cautiously optimistic about higher growth in 2024. However, the reality of these plans is still uncertain, with many CEOs hoping for improved capital access that has yet to materialize.
Download the Full Report
The Benchmarkit team has once again delivered a report rich with actionable metrics. This report is designed to equip you with the insights needed not just to survive but to excel and prosper in today’s challenging environment. By leveraging this data, we can build strategies for success in 2024 and beyond.
Download the full 2024 B2B SaaS Performance Metrics Benchmarks Report here.