Is SaaS Go-To-Market Broken, or Just Not as Good as It Was?

The pandemic tailwinds in 2020 and 2021 were considerable. In fact, based on the helpful work of David Spitz, we know that public SaaS businesses during that period only spent $1.60 in sales and marketing for each new dollar of ARR.
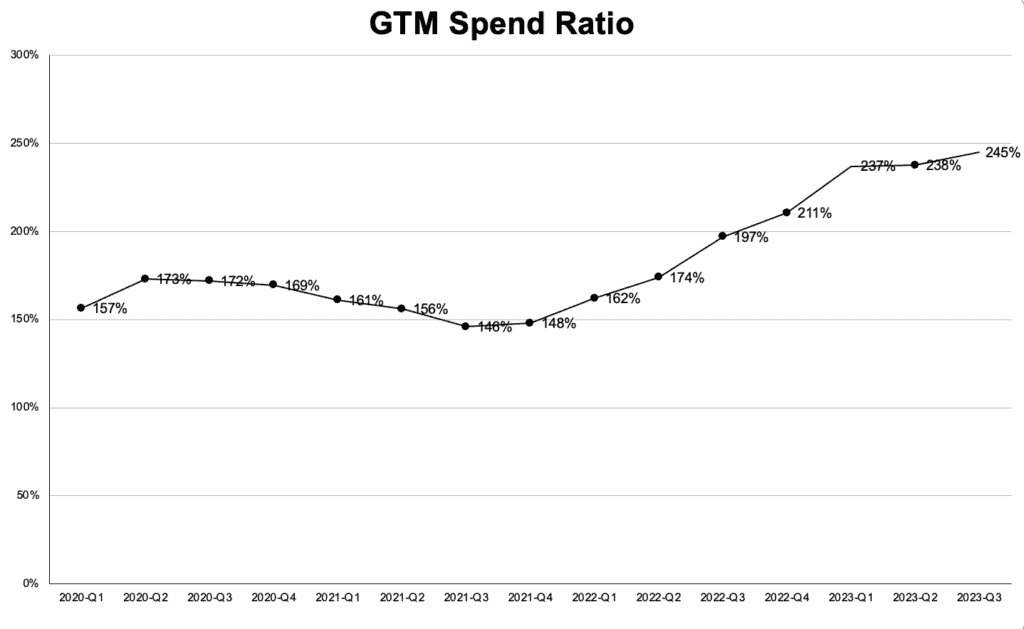
David defines this as the Go-to-Market Spend Ratio, and for our purposes, it is the same as the Customer Acquisition Cost Ratio. Assuming a gross margin of 80% and a retention rate of 90%, that’s a compelling ROI. The math works out to an 80% internal rate of return (IRR) on sales and marketing spending. Here is a link to his original post.
But that was then. Today, the average public SaaS company spends $2.40 in sales and marketing to acquire one incremental dollar of ARR. The IRR on that math is 35%, and that’s why SaaS businesses are worth much less than in 2020.
That said, I would love to have a 35% IRR on all my investments.
So, what’s the takeaway for executives and investors in private SaaS business?
Why Use CAC IRR vs. Other CAC Metrics
This is worthy of a whole separate article, which I will post soon, but in addition to the CAC Ratio, LTV to CAC, and CAC Payback Ratio each having some problematic mathematical distortions; they don’t convey intuitive results or results that can be compared to other potential investments. Is four a good LTV to CAC? Is ten a good CAC payback? People say they are, but the only way to know if the results are intrinsically good or bad is to convert them into an IRR, so let’s start there instead.
Know Your Numbers
The first step is to get grounded in your company’s unit economics of acquisition cost, gross margin, and retention. Metrics can be tricky, so spend some time on this. You must estimate your sales cycle accurately and your long-term retention rate. This linked spreadsheet helps define the metrics and turns them into an IRR for your sales and marketing spending.
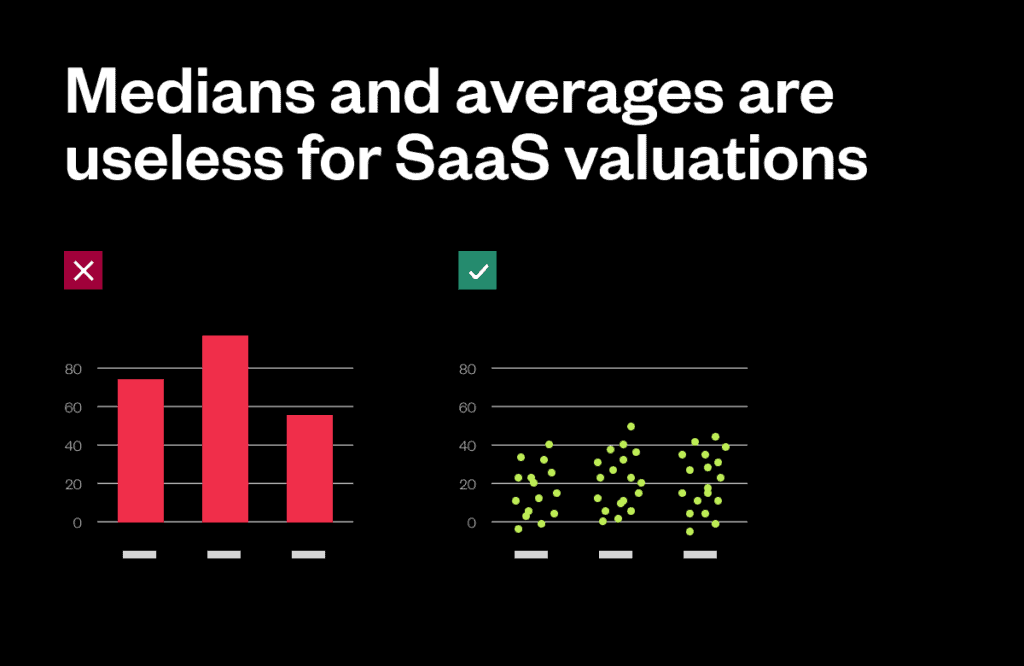
For our purposes here, it’s worth pointing out that almost all metrics are averages, but what should guide investment decisions is actually marginal costs and marginal revenue, which are similar but more difficult to determine. For example, suppose you have twenty salespeople with a good flow of leads. In that case, a new salesperson is likely to perform about as well as the average, so the IRR on your current sales spending will likely hold for the incremental new hire. But suppose you only have five salespeople who are starved for leads. In that case, a new salesperson will likely perform worse than average (or depress the whole group’s performance) such that the IRR on the incremental investment is meaningfully lower than the average before the hire. The breakdown of company profiles below is based on averages, which is fine in most cases, but managers should be mindful of marginal performance when making investment decisions.
Which zone are you in?
With the above caveats in mind, maintain or increase your sales and marketing spending if your current sales and marketing investments generate an IRR above 35%. In the accompanying graphic, your business is in the Investment Zone. Increasing investment until the point the business crosses into cash-burn mode is straightforward; once cash is burned, the cost of capital must be considered.
Why 35%? A high hurdle rate is appropriate here because:
1. Private SaaS businesses, in general, are risky investments compared to the total landscape of investable assets, and 35% is a long-term hurdle rate used by top VCs investing in the space, and
2. Sales and marketing investments inside those businesses are even riskier, so 35% is actually on the low side.
If your IRR is below 25% and you are profitable, you must look hard at your spending and retention numbers. You can improve your IRR by experimenting and becoming more efficient in sales and marketing, but also remember that retention and gross margins contribute significantly to this equation. If you can’t find a way to acquire customers more efficiently, make the ones you do acquire more valuable. This is consistent with the “cash engine” and “growth engine” approach to SaaS.
On the chart, this is the Operational Needs Zone. Businesses in this zone have time to work on their model, and they may or may not choose to cut back on sales and marketing spending, but they should only invest more once they have improved their CAC IRR.
How does burn impact your thinking?
Regardless of your CAC IRR, if your company is burning capital, you need to open the aperture of this analysis to capture your total burn, not just sales and marketing spending. Think of it this way: your company needs to stay in business to make its sales and marketing investments, so the burn becomes part of the incremental investment.
If you are burning money, but your CAC IRR is strong, you are in the Cost of Capital Dependent Zone. Many companies find themselves here today, and it’s not uncommon for a business to create value as a whole, but because capital is so expensive, the current owners don’t capture any of that value. Fundamentally, the growth in the size of the pie is offset by the shrinking size of the slice. Dilution offsets value creation for the founders and current shareholders. Here is a link to a separate model that helps quantify the investment trade offs based on burn ratios, growth rates, and the cost of capital.
Finally, companies find themselves in the Broken Business Zone when weak CAC IRRs are paired with a significantly negative operating margin. These companies need to look at everything the Operational Needs companies are looking at, but they must do it quickly and pair it with a reduction in spending. These businesses cannot spend their way into profitability and are not good candidates to raise money.
Not listed on the chart, but a real possibility I have seen more than once is negative CAC IRRs. If this is where you are, stop spending on sales and marketing—really, stop. Negative CAC IRRs call for a complete reset of the GTM approach.
Takeaway
So, while it’s true that the good old days of 80% IRRs on sales and marketing spending are over, it does not mean that current go-to-market investments are wasteful, but they must be carefully measured.
As always, it’s essential to recognize that running a model differs from running a SaaS business, and modeling may not be helpful in companies with little understanding of the relationship between sales and marketing spending and growth. It is always possible to calculate CAC metrics mathematically, but it does not mean there is a causal relationship. I have seen countless SaaS companies raise capital, spend aggressively, and watch growth rates stay exactly the same or decline. Early-stage companies, in particular, should be careful about ramping up sales and marketing investment based on immature CAC and retention numbers.
All that said, resource allocation is a primary function of senior management and board members, and even with imperfect assumptions, working through this type of analysis should help frame decisions about additional investments in sales and marketing, which may very well create value. However, they may fall short of historical expectations.

Related Content


The State of SaaS Growth 2024
In this report, we present an update on the overall state of today’s B2B subscription marketplace based on the actual billing data of over 2,000 B2B SaaS companies. We discuss:
- The general return to normalized growth levels in 2023
- The differences in “normalized” growth rates for each industry, including which industries grew the most and which proved “recession-proof”
- The impact of billing model on company growth from $0-$1MM, and then to $100MM