How to Interpret Comps When Valuing Your SaaS Company

I have been writing about how to value SaaS companies since 2008, working to demystify the process for founders and investors alike. The more I explore, the better I appreciate there is both a practical and theoretical side to the valuation process.
I have spent most of my time on the theoretical side, examining how things like growth, retention, margins, and interest rates impact SaaS valuations. Now, I’m spending more time on the practical side, focusing on buying and selling SaaS companies. A big part of the practical side is comparing the company being sold to other companies like it. As with home buying, the process is designed to help you value the asset you’re trying to buy or sell.
The problem is, that just doesn’t work.
Blending theory and practice
The theoretical side of the valuation process impacts the practical side and vice versa. Buyers build financial models incorporating the value drivers I mentioned above, and those models affect what they are willing to pay. But the relationship is sometimes less direct than you might think, and the practical side is full of outside influences. Is the VP of Corp-Dev new and looking to make a mark? Or are they going through a divorce? Or does the seller have gambling debts? Seriously, it’s real life.
My recommendation to SaaS founders has always been to understand the theoretical side as best you can and then optimize the practical side.
Understanding the theoretical side means knowing your company’s value drivers (growth rate, retention, gross margin, CAC payback, cash burn, etc.) and how they compare to other companies. This knowledge allows you to best articulate your company’s value. On the practical side, optimizing means running a low-friction competitive process that reaches as many potential buyers as possible.
Private market comparable transactions
As I spend more time on the practical side of the equation, helping bring SaaS companies to market, I have been digging through the voluminous and expensive databases of private market transactions commonly known as running comps. As you may know, this involves evaluating a list of private M&A transactions for businesses similar to yours.
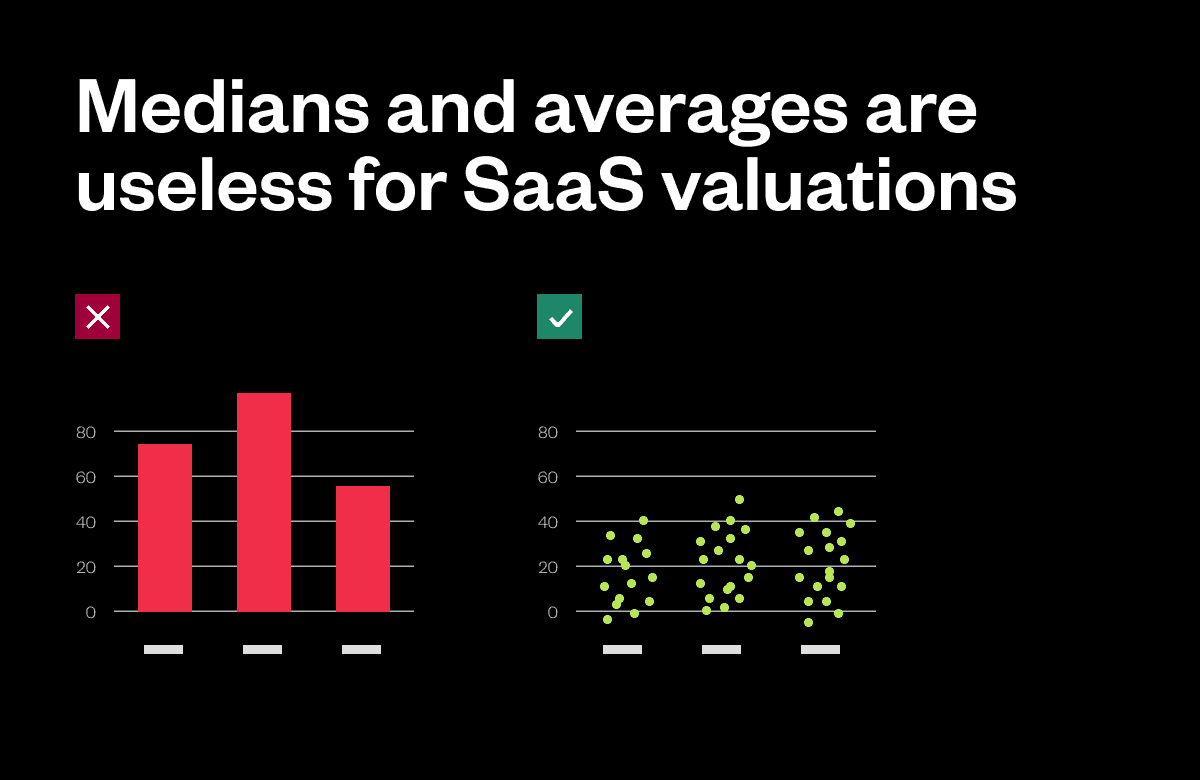
The chart below shows the median valuation multiples of four hundred private software businesses with revenues less than one hundred million sold over the last two-plus years. There’s nothing wrong with the chart. It, just doesn’t tell you much.

Look at the underlying data, and you’ll see how unclear this picture is. Valuations are all over the place.

In each of the last ten quarters, at least one software company has sold for less than .1 times revenue and one for over 40 times revenue. Unfortunately, most private data doesn’t contain detailed operating metrics on the companies acquired, so it’s hard to know the differences between the ones that sold for 40 times vs .1 times.
You can build a median from any data set, but it’s meaningless if the underlying distribution is too broad and the attributes of the data points are unknown. It’s like knowing the average home price in Cincinnati is $250,000. That’s not super helpful. You want to know the average price of a three-bedroom home with a new kitchen in a specific school district.
The data is further biased because each dot is an entirely different company. One quarter could be full of exceptional companies, while another could be full of duds, causing a change in valuation multiples that has nothing to do with market conditions and has no impact on your business.
All that said, what can we learn from the transactional data?
Psychologists and data scientists suggest humans are good at spotting patterns in large data groups, so rest your eyes on this chart again.
One thing is clear: there are fewer dots on the right than on the left. This indicates a slowdown in the number of transactions. From a seller’s perspective, that means lower demand, which might impact the price or even the likelihood of a completed transaction. It’s also clear that the number of transactions above 10X has virtually disappeared. That information is obfuscated in the chart, showing only the median values. The chances of a “frothy” exit have almost disappeared.
Beyond these limited observations, however, comps still aren’t good for much.
Evaluate your business using a public market approach
The public markets are a better place to start. Below, I’ve outlined a streamlined approach to valuing your SaaS company based on public data.
Begin by selecting a recent valuation multiple from a public benchmark that serves your needs best but is still defensible. Your choices include the Emerging Cloud Index, the SaaS Capital Index, or an index based on your specific SaaS segment. (See Saasonomics.com for a list of segments I put together.) Pick the one with the highest multiple.
Second, discount the valuation multiple by 25%. I looked up six studies on the long-term average discount of private companies to public companies, and the answers all fell between 20% and 30%. I would stick with 25%. It’s straightforward and entirely defensible.
Third, adjust the multiple for your growth rate. This is done by comparing your company’s growth rate to companies with a similar level of ARR (not public company growth rates). For every ten percentage points (not percent) your company is above or below the median growth rate for your ARR cohort, add or subtract 2.5 from your starting valuation multiple. The Maxio Institute has private growth rates by ARR.
The Growth State for B2B SaaS Businesses
We’ve analyzed the billing data of over 2,100 B2B SaaS companies between 2022 and 2023—download the report to learn what we found.
Fourth, adjust for profitability. This is less precise. Higher growth SaaS company valuations are not impacted much by profitability, so ignore profitability if your growth rate is above 30%. Even if you’re growing less quickly, ignore profitability if your operating profit margin is within ten percentage points of zero. If you have an operating profit margin in the 15% or above range, start adding to your multiple, and if your loss is 15% or more, start subtracting.
Finally, adjust for retention. Gross revenue retention is the driver and should be treated like profitability. Give yourself bonus points if you are five or more points above 90%, and subtract likewise in the opposite direction.
There are dozens of other factors that will impact your valuation. Still, they tend to be idiosyncratic or less important than those mentioned above.
What this means
SaaS company founders and investors don’t need access to secret, proprietary data on comparable sales. It’s just not that useful. Accessible and timely public data can give you most of what you need to value your SaaS company. If you are selling your company or raising equity, use the valuation process above to hone your arguments for a higher value and establish a reasonable valuation range. Once that’s done, do your best to optimize the outcome by creating a low-friction competitive process.
About the Author
Todd Gardner is the Managing Director of SaaS Advisors and the founder and former CEO of SaaS Capital. Todd was also a partner in the venture capital firm Blue Chip Venture Company and was a management consultant with Deloitte. Todd has worked with hundreds of SaaS companies across various engagements, including pricing, capital formation, M&A, metrics, valuations, and content marketing. Todd is a graduate of DePauw University and Indiana University.
Todd was recently a guest on our Expert Voices podcast. He chatted with our CEO, Randy Wootton about the current state of the capital markets for SaaS companies and the recent deceleration in the growth rate of SaaS companies. Todd emphasizes the value of three key metrics for fundraising: growth, profitability, and retention.
Related Content

The State of SaaS Growth 2023
We’ve analyzed the billing data of over 2,100 B2B SaaS companies between 2022 and 2023 and have presented key insights, including:
- Growth rates of businesses based on billing type
- Where some of the fastest growing companies are located
- The bar for raising your successive round of investment.