A Better Way to Measure CAC

No metric takes into account all aspects of a business’s performance, and in fact, the more variables you add to a metric, the harder it is to unpack and address root causes.
That said, some metrics are better than others, and when assessing a SaaS company’s customer acquisition cost, calculating it as a return on investment (IRR) is more accurate and informative than calculating a CAC Payback Period (CPP) or LTV to CAC Ratio.
Why?
There are three reasons.
- CAC Payback Period does not address churn, the most powerful driver of SaaS unit economics. It’s difficult to know if a CPP result is good or bad unless you know the underlying stickiness of the revenue stream.
- Conversely, LTV to CAC emphasizes churn too much because it ignores the time value of money. If your company’s net retention rate (NRR) is above 94%, the assumed lifetime value of your customers becomes absurdly large. In fact, as NRR approaches or exceeds 100%, each of your customers becomes infinitely valuable. The workaround is gross revenue retention GRR, but that’s only a workaround because the formula can’t deal with high retention percentages. There is no good reason expansion revenue should be excluded, which is what happens when you use GRR.
- Lastly, the results of these metrics are not intuitive. Is 13 a good CAC Payback? Is 4.1 a decent LTV to CAC? The metrics must be benchmarked for context because they don’t hold meaning themselves. Benchmarking is fine, but it has drawbacks regarding directly comparable companies, sample size, and consistent metric calculation.
There is a better way. We eliminate all these issues by rearranging the same inputs into an internal rate of return or IRR calculation.
Also, using an IRR approach, sales and marketing investments can be compared to any other investment. Is a 50% internal rate of return good? Of course. Is a negative 10% return good? No. You don’t need to benchmark–the result is entirely intuitive.
CAC IRR takes no more data than the CAC Payback Period calculation and is easy to calculate. Spreadsheet here.
You still need to go through the process of aligning your spending with the new ARR it generates. To do this, you need a good understanding of your sales cycle because that is the period by which you lag the measurement of incremental ARR from the spending that generated it. As you may have seen in other posts, it’s also helpful to separate expansion revenue from new revenue and track their respective acquisition costs separately.
Once you have aligned your sales and marketing spend as best you can with increases in ARR, simply divide the former by the latter, and that’s the CAC Ratio. Despite the comments earlier, the CAC Ratio is a helpful building block for CAC IRR and valuable in its own right when trended and contextualized with the IRR calculation.
The strength of the CAC Ratio is its simplicity. It’s more challenging to manipulate, and it focuses on only one aspect of the business–sales and marketing efficiency.
The last two puzzle pieces for CAC IRR are gross margin and retention rate. If you separate New CAC from Expansion CAC, use GRR for the calculations because these metrics address expansion revenue separately. If you calculate a combined New and Expansion CAC IRR, use NRR even if it’s over 100%.
To visualize the cash flows driving CAC IRR, let’s assume a company has a CAC Ratio of 2.0, a gross margin of 80%, and a net retention rate of 95%.

The accompanying spreadsheet generates this chart and the CAC IRR.
This chart is based on unit economics, but it can also be shown with total sales and marketing spending for the period and the total gross margin dollars from the cohort of customers acquired with that investment.
Notice here that the cash flows stop at year 11. This was somewhat arbitrary, but cash flows beyond year ten don’t impact the result much and can be dropped. This is also closer to reality than the LTV to CAC calculation, which considers each customer with an NRR greater than 100% infinitely valuable.
This model shows annual in-advance payments, but there are tabs in the spreadsheet for monthly and quarterly payments.
The CAC IRR based on these assumptions is 58%. Pretty good.
The good news is that communicating CAC IRR is relatively easy despite being a new metric. If you tell any investor the IRR on your customer acquisition costs is 58%, they will understand immediately.
As with any compound metric, operators must peel it back to address the underlying drivers, but the IRR approach is the most comprehensive and intuitive place to start.
Related Content


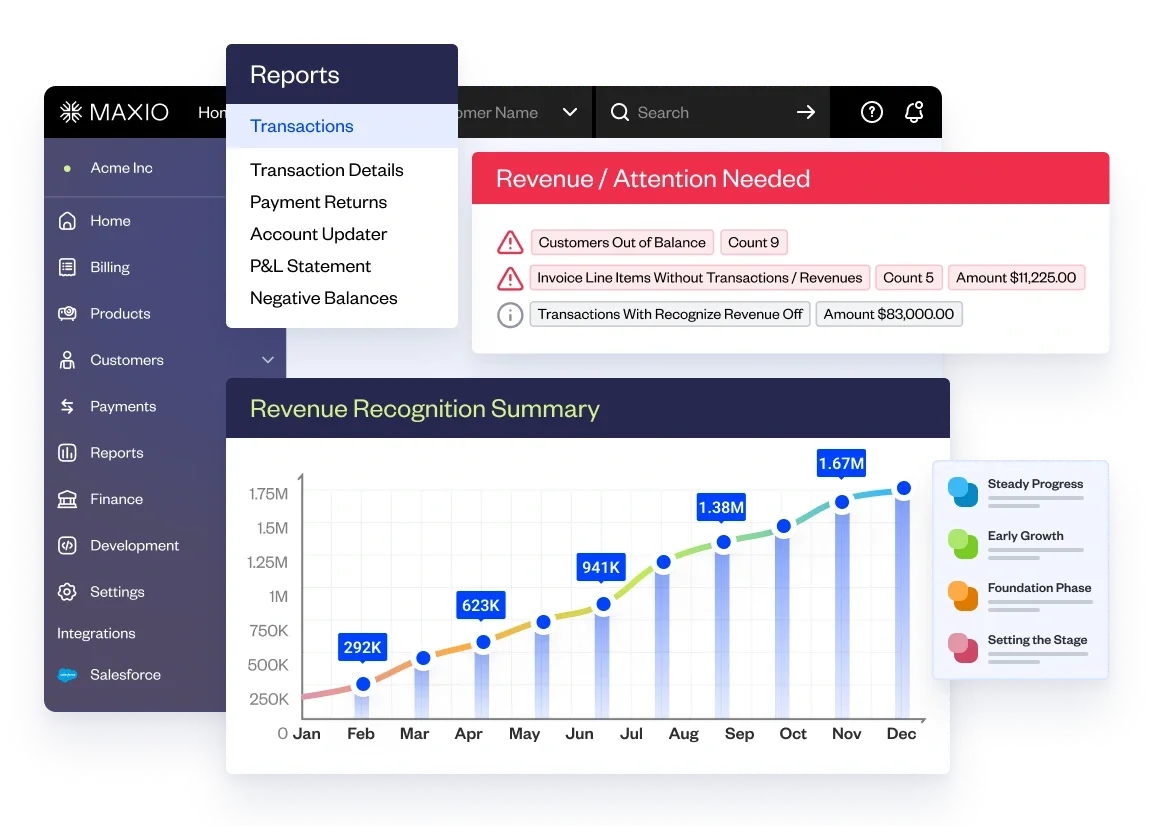
Your Plug-and-Play SaaS Metrics Dashboard
In this template, you’ll find a comprehensive set of pre-built SaaS metrics (that you can trust) to wow investors and make key business decisions with confidence.
Chart your path to profitability with metrics like:
- Subscription Momentum (ARR, customer count, average ARR)
- Churn & Retention (churn rate, renewal rate, net revenue retention)
- Customer Lifetime Value (CLV)