How to Build a Top-Down ARR Model

The following blog post explains how to build a top-down ARR model and is excerpted from The Complete Guide to SaaS Revenue Modeling, a collaboration between Maxio and Burkland Associates.
You can download the complete guide here.
The top-down ARR model approach involves looking at historical trendlines for ARR growth and extrapolating future growth based on those trendlines. By and large, it’s a much less detailed approach than the bottoms-up model, making it quicker to build and update and easier to make high-level adjustments.
Who Should Use This Model?
The ideal company profile for the top-down ARR model is a later-stage company with enough history and revenue growth to-date that the historical trend lines are representative of future growth projections.
A good rule of thumb to follow is that a company should have at least 2 years of revenue history. However, you’ll need to ensure that the history being used for growth extrapolation is a good proxy for future expectations: e.g. similar use case/types of customers, product lines, expected revenue/customer, etc.
A SaaS business that started with a self-service model but is now looking to expand into Enterprise may not be able to use their historical trends as a proxy for future growth if the growth patterns are not comparable.
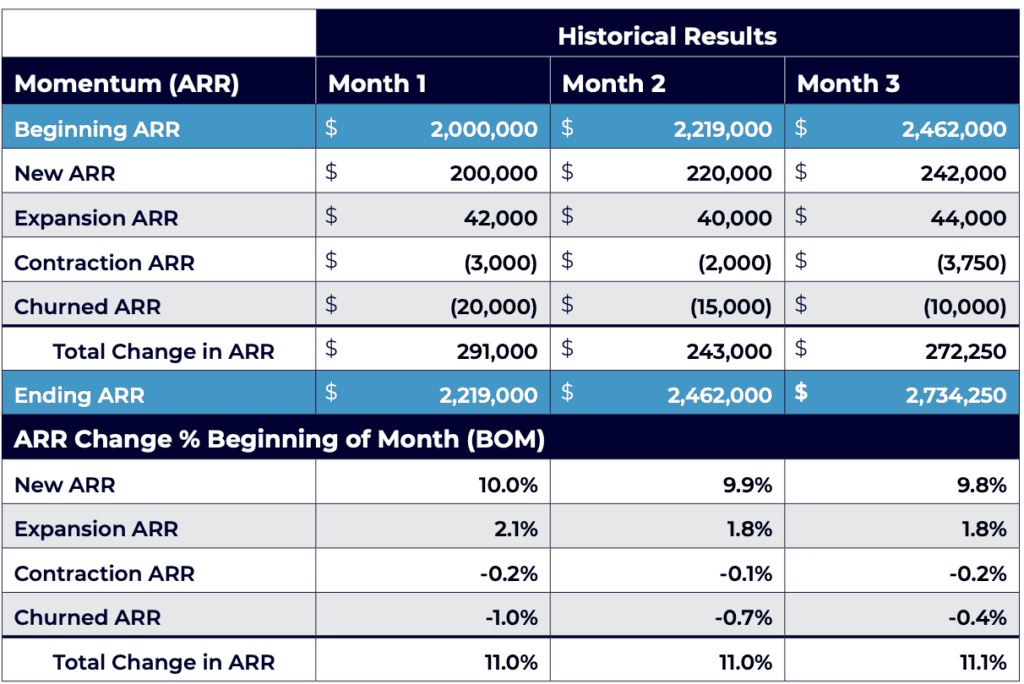
Step 1: Build out your history
You’ll need to ensure that you capture a historical ARR momentum chart, including ARR change as a percentage of the beginning of month (BOM) ARR, as shown in the table below:
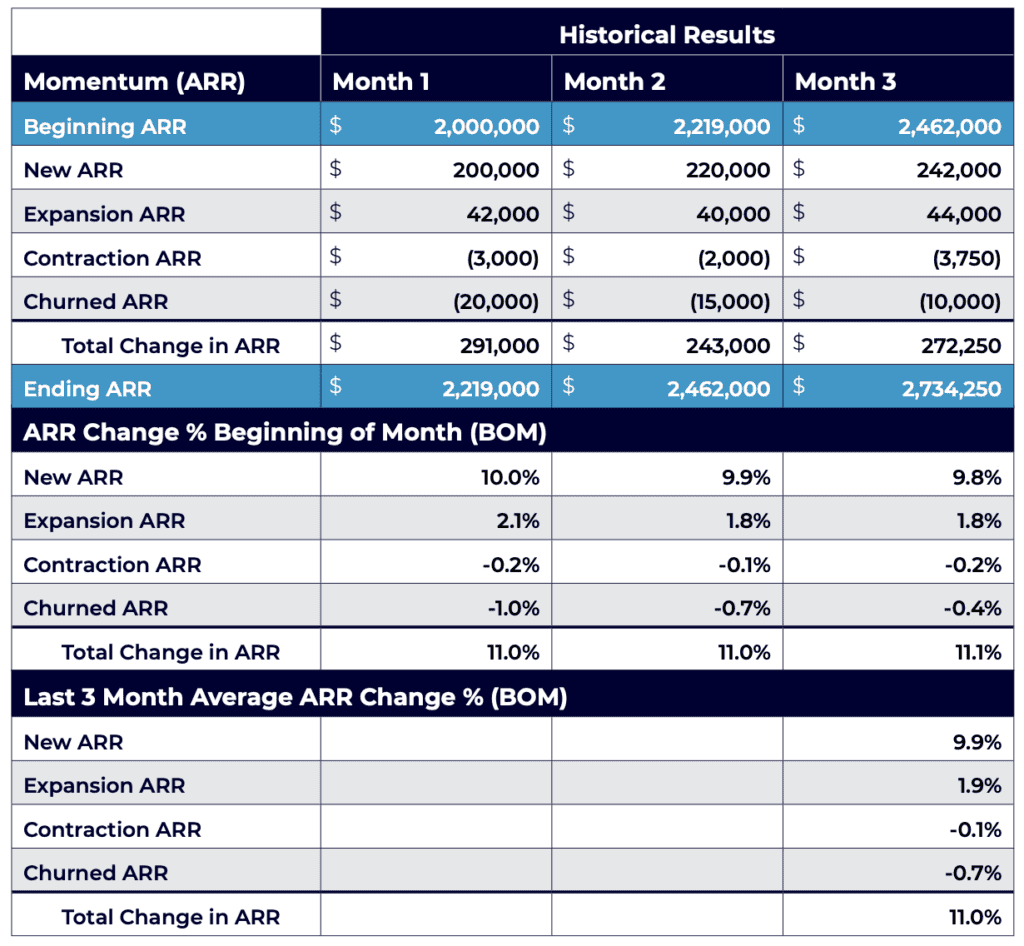
Step 2: Calculate your average historical growth rates
Calculate averages for New, Expansion, Contraction, and Churn ARR as a percentage of the beginning of the month ARR over a relevant time period. It’s important to use averages to extrapolate future growth as opposed to a single month growth rate because there can be a lot of variability between months. This is especially true at earlier stage companies where losing a single customer can account for a large portion of your ARR.
In many cases, it makes sense for companies to look at the latest 12 month average of the monthly growth rates and use that average to extrapolate future growth. Using a full year time period to calculate the average helps to blend out the variability in growth between months. However, for some earlier stage startups, the growth trends may shift significantly over a 12 month time period, so looking at a 12-month average may not be representative of future growth. In these cases, it may instead make sense to look at the average growth rate over a 3- or 6-month period. The example below shows averages calculated for the prior 3 months:
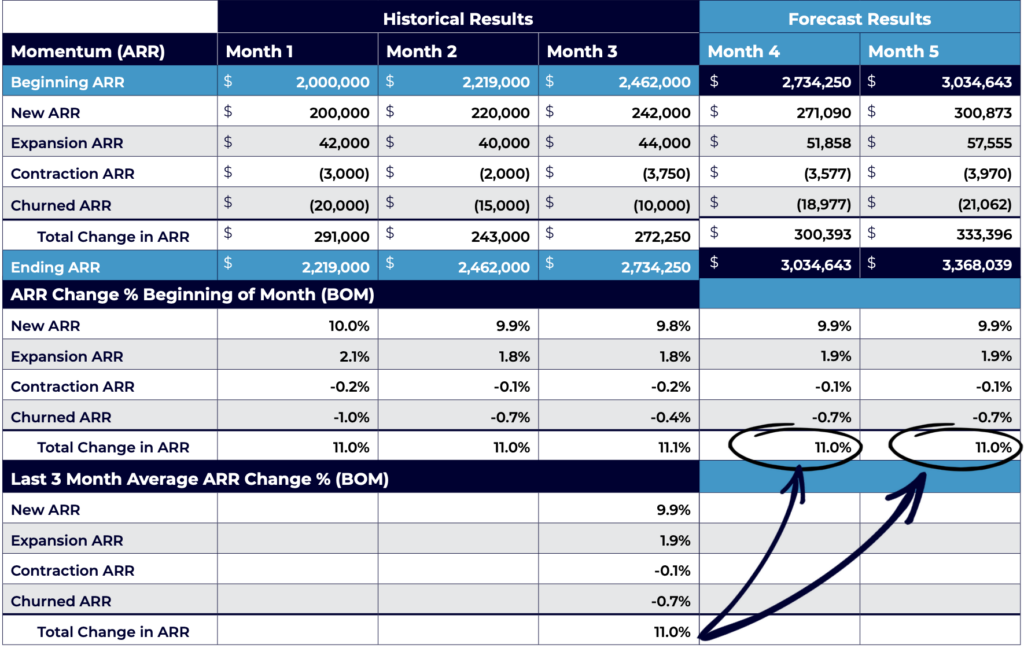
Step 3: Use historical growth rates to estimate future ARR
The table below shows the methodology for extrapolating growth using a 3-month average. As reflected in the table, the ARR growth broken out by growth component is calculated for three months of actual historical results, and an average of the last three months of growth is calculated. This 3-month average is then applied to forecast future growth for New, Expansion, Contraction, and Churn ARR.
Step 4: Make high-level adjustments to extrapolated growth
Building forecasts based solely on historical trendlines doesn’t always drive a realistic forecast. It can fail to take into account actions the company has taken that will impact changes in the trendlines. For example, perhaps your company is making significant investments in sales or marketing which will accelerate your ARR growth. You will need to factor in these types of adjustments when building your model.
Bonus: How to Get More Detailed
Depending on how granular you’d like to get, you can build separate ARR forecast analyses for different business segments that have different growth profiles (e.g. SMB vs. Enterprise or different industries).
Say, for example, you expect future pricing changes and want to be able to explicitly bake that into the model. You can prepare a forecast that breaks out your historical ARR on a per-customer basis and the average price for each customer. Then, for each new customer you project to add, you can use the expected future price multiplied by the estimated number of new customers to calculate your estimated new ARR.
Key Pain Points
While the top-down approach has many advantages, chief among them being their relative simplicity compared to bottoms-up modeling, there are a few drawbacks.
Firstly, due to the high-level nature of the extrapolation, it can be challenging to factor in known shifts in the business at a more detailed level, like pricing changes or new product launches.
Secondly, investors often want to see more detail behind high-level growth assumptions, which can make raising capital more difficult. To address this concern, you can supplement your top-down model with other analyses, such as a TAM (total available market) analysis, a review of pipeline/targeted opportunities, or any other analyses of revenue driver trendlines. Even so, some investors like to see a closer linkage of the revenue drivers to the financial model.
Other Considerations
Companies that do top-down ARR planning can and should still separately track and monitor their key revenue drivers, even if they aren’t what’s used to drive revenue in their financial model.
These revenue drivers, such as conversion rates, are key funnel metrics that are critical for the business and are KPIs that the company should track and report on.
An understanding of the trends for these key revenue drivers should inform the topline assumptions.
For example, if a company expects that their conversion rates will increase due to a marketing initiative, they can factor this into their top-level assumptions around new ARR growth.
To learn more about ARR modeling, download the Complete Guide to SaaS Revenue Modeling.