The typical SaaS startup mindset is growth at all costs, with 89% of SaaS executives singling out new customer acquisition as a top priority.
But, considering the initial sale is a minor part of the MRR or ARR of an established company, there’s not enough focus on retaining and maximizing the value of existing customers.
By looking at your data from a pricing perspective, you can identify monetization opportunities and highlight problems in your funnel that lead to customer churn.
In this article, we’ll cover crucial metrics for product usage, sales and billing, and how you can use them to gain insights to grow your MRR.
How you can use product usage data to improve billing strategies
There is a strong connection between user engagement and billing patterns.
User engagement data — how your customers interact with your software products — will show patterns in usage. Recognizing these patterns can help you improve retention with dunning campaigns, adjust your prices, and maybe even inspire a new pricing model based off of where your customers are actually spending their time.
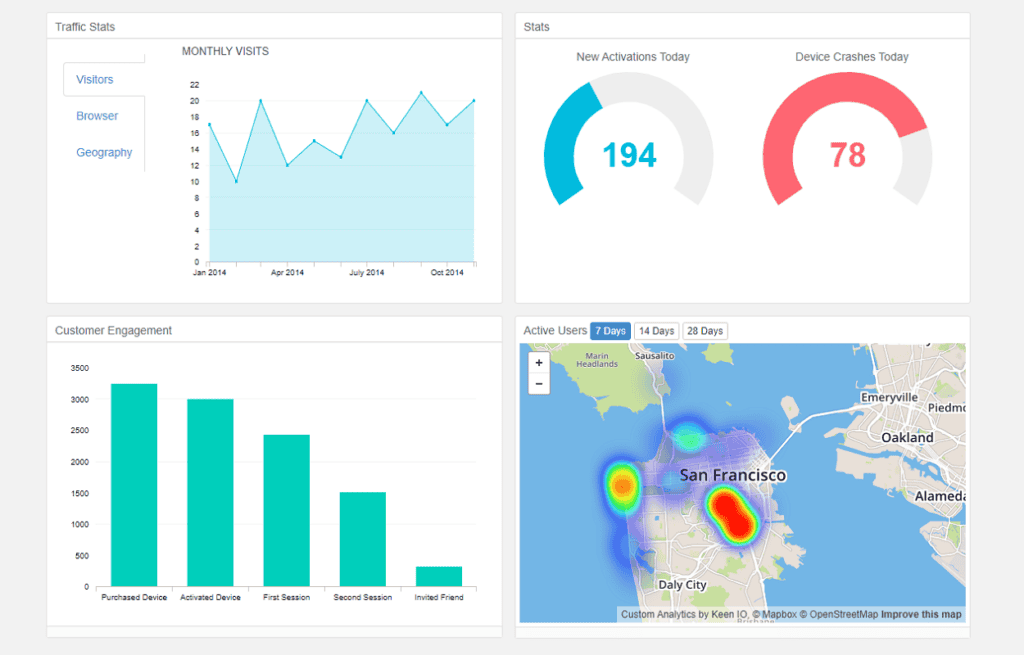
If you focus on the right data points, you can answer critical questions about how your customers are using your product and where they are deriving value. These insights are critical to optimizing your pricing, billing and monetization practices without having to resort to dedicated pricing surveys and research, which can be costly and less reliable than the actual product interactions.
What are the most important product usage metrics?
There are a lot of different data points you can measure and use to evaluate your user engagement levels. But for the most critical insights from a pricing perspective, you should focus on the following metrics:
Active Users
The number and percentage of active users in a given period can help you forecast churn numbers and predict potential issues with cash flow.
The most relevant period or cohort depends on your product, industry and users, but the majority of SaaS companies focus on daily and monthly active users.
Rather than a formula, the total number of active user numbers rely on accurately tracking the key activities your customers need to take. For example, a typical measurement could be number of logins from your user base. However, some products don’t require customers to login to use the product. In these cases, it’s important to understand key activities to determine which events within your product to track, such as API calls for an integration software. Event data can be hard to track, but tools like Keen.io can help simplify the process for companies.
Stickiness
How you measure stickiness depends on your product and how often the average active customer accesses your software.
For a consumer social media app, product stickiness can be calculated by using the following formula:
No. of daily active users (DAU) ÷ no. of monthly active users (MAU)
But for a B2B analytics app, even power users might only log on once or twice a week, so determining how often a user is expected to use your product is important. For example, weekly active users (WAU) divided by MAU could be more appropriate.
Number of User Actions per Session
How you define a user action is integral to the insights you can gather. If you only count basic activities like opening a marketing email or logging in, you could make lower quality predictions than if you single out key user actions like viewing a report or sending an SMS message.
Total actions ÷ sessions during period
You can view the averages for your user base to identify seasonal changes in demand for your product or focus on the individual user to find customers at a higher risk of churning.
Product Adoption Rate
The rate of adoption highlights the percentage of new users that eventually end up being productive customers. The formula is very straightforward.
No. of active users ÷ total users
The closer to 100% you get, the better, but that’s wishful thinking. Aiming to keep it in the high 90s is a great KPI for any SaaS company.
D1, D7, D30, W1 Retention
Similar to monthly active users, the retention metric is most useful when you measure it at a variety of different intervals.
The basic formula looks something like this:
Active users during period ÷ no of initial users x 100
Measuring the lifetime of an active user is not just for visualizing churn with retention curves, but also to highlight potential billing or pricing issues.
Are your heaviest users paying for their resource usage?
If you only offer basic tiered plans or a fixed-rate subscription, your customers could be under or overpaying for their monthly subscription.
You don’t want a significant mismatch between the resources your heaviest users use, and their value. If that’s what you see when you run the numbers, you might want to reconsider your pricing model.
To figure this out, you need to look beyond regular usage data.
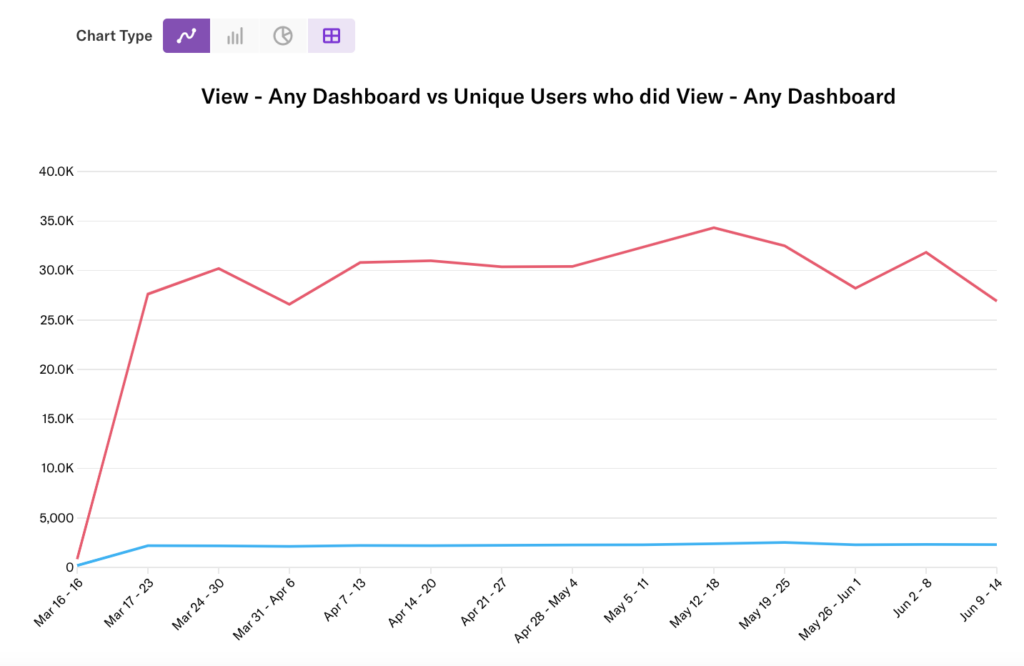
Even regular users will have tens, if not hundreds, of actions or events per login. By tracking usage events on a user-level, you can identify those who process many times the average.
Keeping track of these numbers is especially important for resource-intensive products. Think product email APIs, app testing and deployment solutions and more.
You can use an event data management solution to capture and analyze this data in real time.
Pricing based on value metrics
Tracking user actions and events isn’t just about collecting data. Sure, it’s useful to know how many vital actions your users take (emails sent, reports generated, revenue generated, etc.).
But to take things to the next level, you need to go beyond just measurement. You can use these metrics to control the amount a subscriber pays each month.
This billing method is called events-based billing, which some refer to as metered billing. This goes a step beyond basic subscription billing to tie your pricing more to the value provided. You can single out billable event metrics that will control the price of your product for your customers.
It works best when you highlight metrics that reflect the business outcome of using your product. These data points are commonly known as value metrics and can be a tremendous competitive advantage.
SaaS companies that follow this model have consistently shown higher growth numbers than competitors that don’t.
When your users see a direct connection between what they pay for your product and their bottom line, it’s easier to pay the bill month after month.
The connection between user engagement & canceled subscriptions
According to Retently, the three leading causes of SaaS churn are poor onboarding, weak relationship building, and poor customer service.
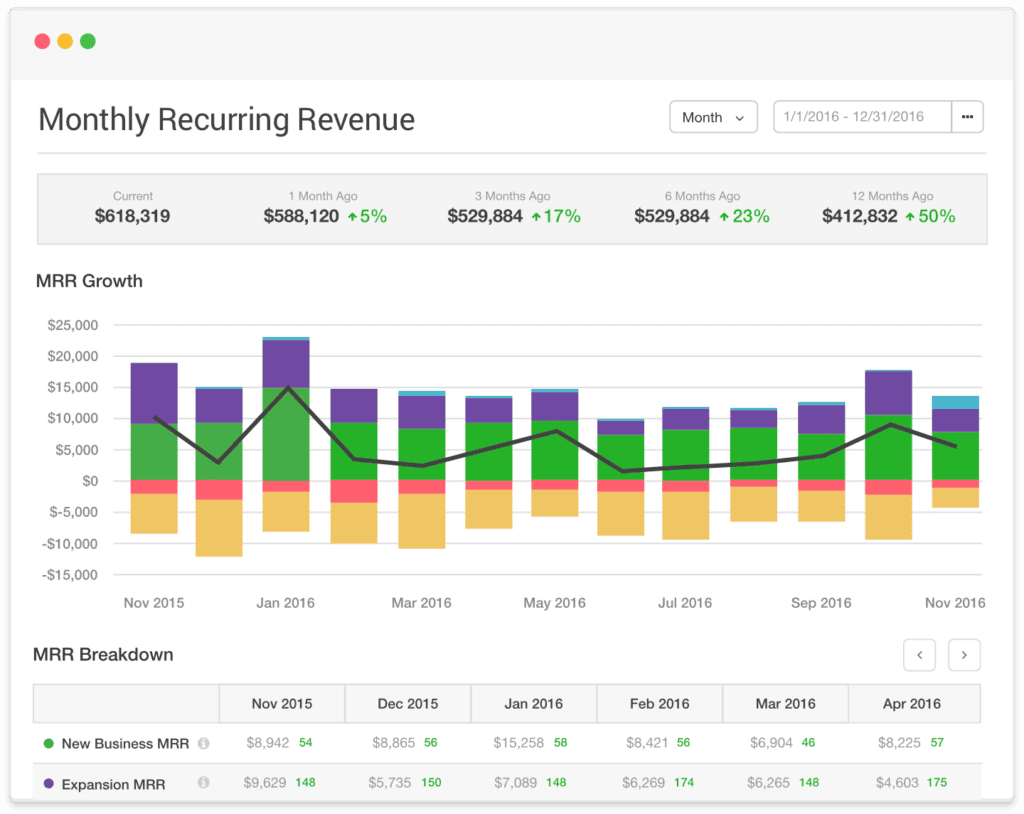
But how can you identify that a user is having problems before they cancel and answer an exit survey?
Before a user churns, there is very often a prolonged period of inactivity or reduced product usage. It’s one of the most straightforward factors in evaluating the risk of cancellation or churn.
As a result, when users remain inactive for long enough periods, some companies already consider it as a churn event.
By monitoring usage data, you can identify critical moments in the billing cycle before users officially cancel.
Instead of just waiting for them to churn, you can take action.
You can send activation emails, surveys and implement retention campaigns to keep them as customers in the long term.
You can also use these slumps in activity to predict cancellations and forecast revenue more accurately.
How you can use marketing & sales data to improve pricing and billing
Business metrics related to marketing, sales and customer retention tell a story about how your business is doing. With the right tools, you can assess revenue, growth, historical comparisons and more.
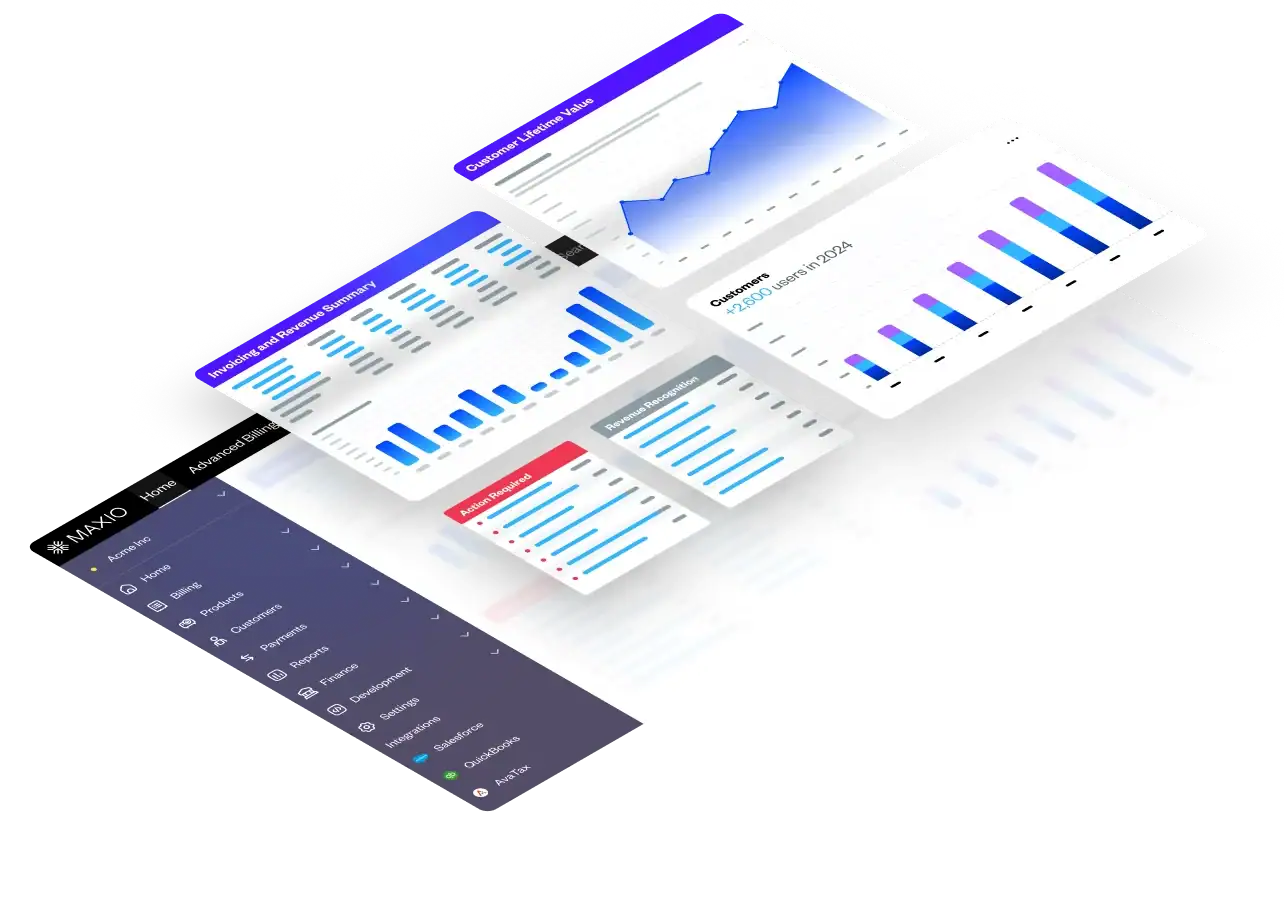
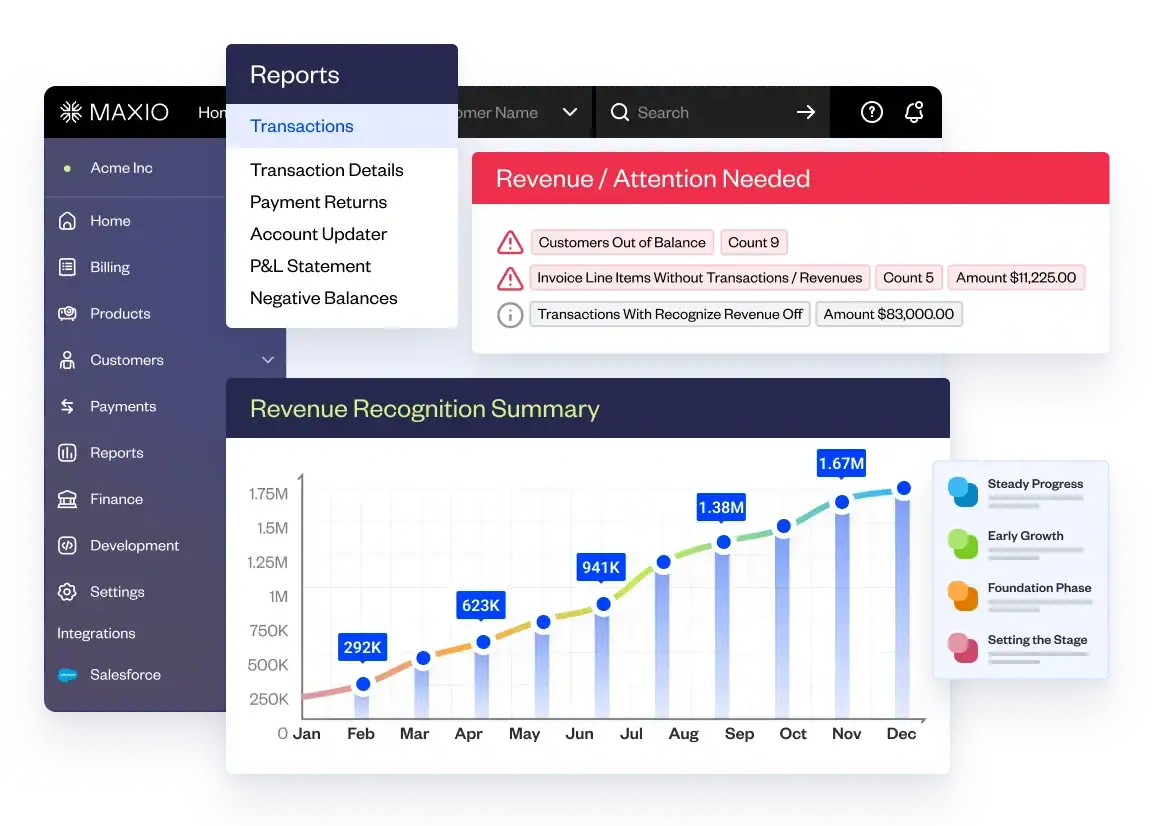
The Maxio dashboard offers a variety of different MRR reports — focusing on growth, churn and identifying the contributing factors for it all.
You can use this data to guide your billing and pricing decisions. You might find a basis for doing pricing research or evaluate whether your company could benefit from switching billing models. You can often find essential insights that lead you to a better pricing strategy and monetization.
But many companies just use the numbers to scale their marketing budgets up or down. If their profits are up, they increase their ad spend and vice versa. If you want to get ahead of the pack, you need to approach things differently.
Relevant business metrics
There are countless sales and marketing data points that you can track and analyze.
For billing purposes, you should measure the following business metrics:
1. MRR
Monthly recurring revenue (MRR) is the fundamental business metric for any SaaS company.
If you don’t have a billing management system, you can calculate it using this formula:
Average revenue per user (ARPU) x total number of users
To find the ARPU, you can either divide your revenue by the number of users or calculate the ratios of different tiered plans.
If you use your monthly revenue numbers, make sure to divide quarterly and annual contracts, and exclude one-time payments from the totals.
2. CAC
Customer acquisition cost (CAC) measures the effectiveness of your marketing strategy. It highlights how much each new customer costs your business.
Marketing costs (ad spend, agency fees, team salaries) ÷ no. of acquired customers
For realistic CAC numbers, you need to factor in fees and salaries — not just ad spend alone.
3. Conversion Rates (Freemium)
The freemium model is omnipresent in the SaaS industry, from Spotify to Salesforce. If your company uses it, the freemium to paid conversion rate is an essential metric to track.
No. of users who become paying customers ÷ no. of free users
Since only paying customers are contributing to your bottom line, you need it to be as high as possible.
4. CLTV
Customer lifetime value (CLTV) shows how much a single customer is worth to your company throughout their entire subscription.
The average revenue a customer generates is easy to calculate.
Average revenue per user (ARPU) * average lifetime (subscription length)
If your customers stay subscribed for 7 months on average, and your ARPU is $30, the average lifetime value of a customer is $210.
5. Churn Rate
The churn rate highlights how quickly your customers are canceling their subscriptions.
No. of lost users at end of period (exclude new users)
________________________________________________________
No. of users at the beginning of period
For example, if you started March with 100 users, added 20 new ones and lost 5 to cancellations, it would look like this: 5 ÷ 100 x 100.
Simply exclude the new users gained during the most recent month, year or other period you use when calculating churn.
6. Renewal rate
The renewal rate measures the ratio of customers that renew their subscriptions at the end of each subscription period.
No. of users who renew their subscription ÷ no. of users at start of period
It is basically the inverse metric of the churn rate, but it’s easy to measure across different kinds of plans and contracts.
7. Expansion Revenue
Expansion revenue is the revenue generated beyond the initial price of a customer’s subscription or contract. Essentially, it’s all the additional sales generated from upselling, cross-selling and plan upgrades.
Calculating expansion revenue requires a very complex formula and precise revenue tracking. If you want to measure it, it’s better to use a revenue management platform like Maxio than going to work with spreadsheets.
Is your pricing model right for your target customers?
By looking at metrics like your freemium conversion rate, you can get a basic idea of whether or not you’ve chosen the right pricing model for your customers.
While anywhere from 1-10% churn rates are touted as SaaS benchmarks, applicable conversion benchmarks depend entirely on industry, product and target market.
Here’s an example of freemium conversion rates (the rate that users move from freemium to paid plans) for larger SaaS companies:
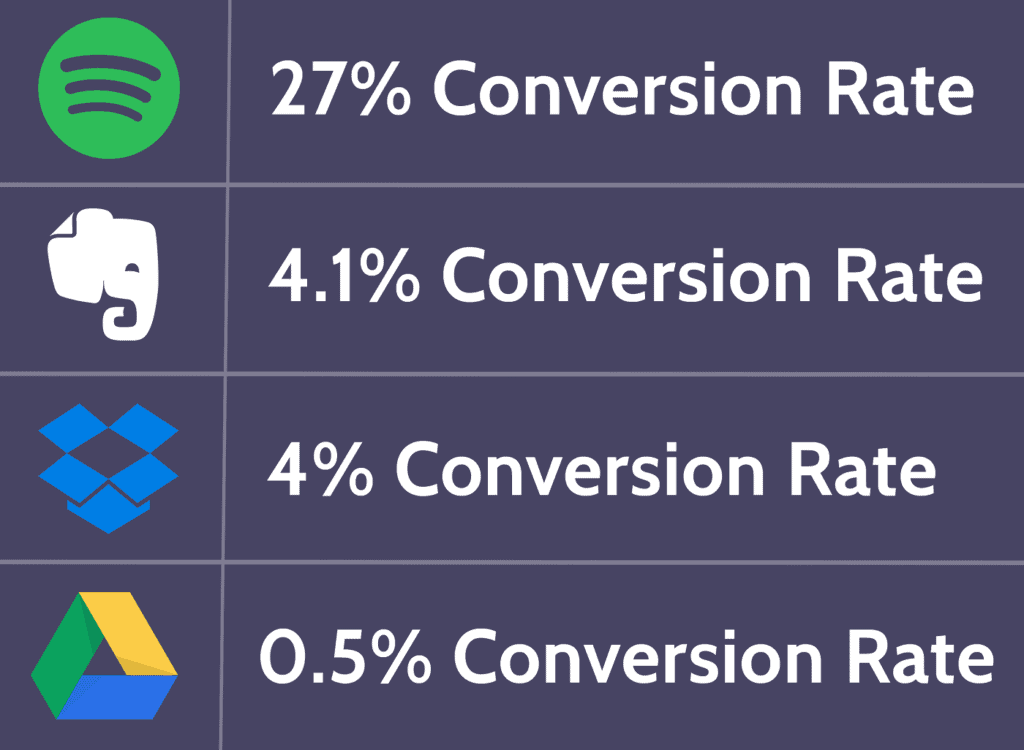
Spotify has an obscene conversion rate, 54 times higher than that of Google drive. But why? Sure, Spotify has a more limited free version, with advertisements and limited features.
But it’s also related to the industry. Consumers are used to the idea of paying for music. At $9.99 for unlimited albums and songs, the price comes across as a steal.
Because of Google’s offering of Gmail and other social media services, the average consumer isn’t used to the idea of paying for file storage.
By comparing your freemium conversion rates with industry benchmarks, you start to answer important questions. Are you offering a too complete freemium version? Do your users have a strong enough incentive to upgrade? Is your pricing a factor?
Do you charge too much, or not enough?
Several business metrics can give you an indication of your prices being too high or low.
If you have unusually high churn rates, it could mean that you are charging too much in a competitive industry.
Are your numbers in line with the industry benchmarks?
If your churn rate is lower than, or within a few decimal points of the median, you have nothing to worry about. But if it’s more than a % higher, you should be concerned.
At the same time, you can’t sacrifice everything for higher conversion rates. You need to consider your CAC and CLTV ratio, as well as other metrics.
If you have excellent conversion rates, but a much lower price than your competitors, and struggle to gain back your acquisition cost over the customer lifetime, increasing your prices could be the right monetization move.
Does your trial user journey naturally lead to subscriptions?
Have you created a streamlined journey that naturally leads trial users to go from testing your product, to initiating the first billing cycle?

The trial version of your product needs not just to deliver value to your users, but also promise even more value through upgrading.
Slack does a great job with discreet upgrade prompts when you approach the limits of your free plan.

Make sure you consider this when designing the user experience of your freemium product. The balance between a useful product and the promise of more is hard to find, but it’s how you maximize revenue with a freemium model.
The impact of advanced subscription data & analytics on your bottom line
Even if you use a basic payment gateway like Paypal, you can still find your way to essential metrics like MRR and churn rates.
But when you want to dive deeper into subscriber relationships, they come up short.
With Maxio, the data is not just limited to MRR, subscription numbers and retention rates. You get advanced segmentation options based on cohorts like reactivation, dates and more.
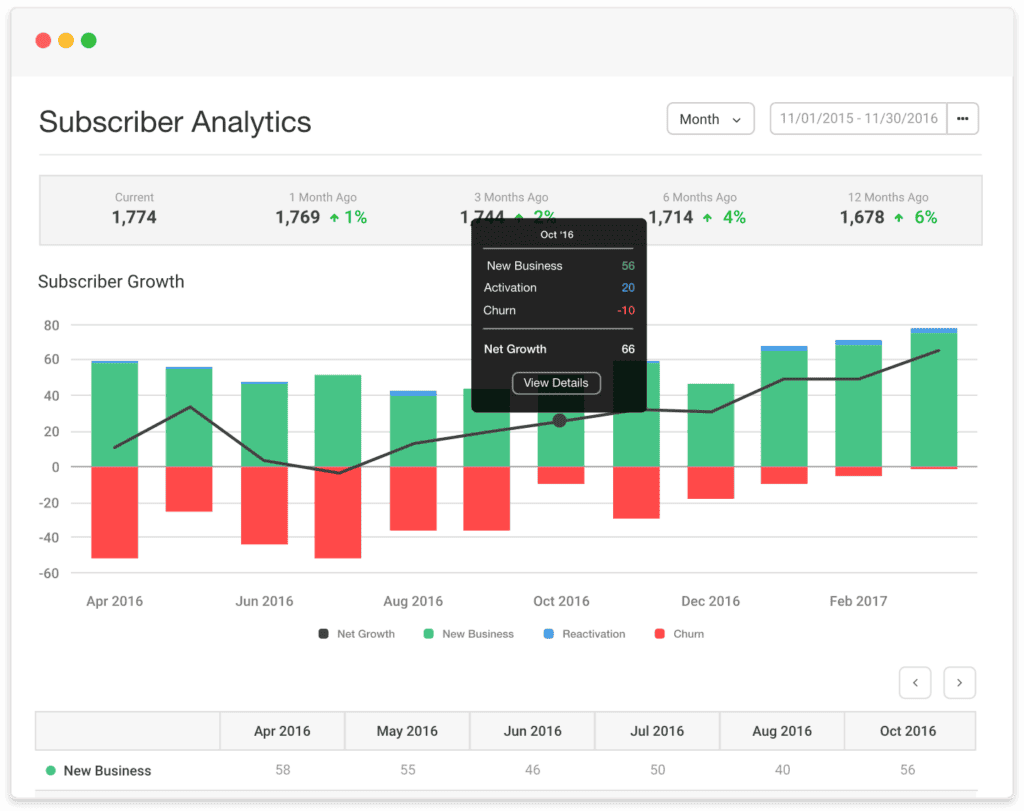
With more flexible reporting, you can get deeper insights into the health of your pricing models and cashflow.
Our subscriber analytics report lets you compare new business numbers historically, as well as reactivation, churn and net growth, while freely setting your cohort.It makes it easy to see, at a glance, how your acquisition and retention efforts are performing, month over month.
Increase your billing efficiency
With the ability to run tests and measure results, you can optimize the billing efficiency to improve the cash flow of your subscriptions.
If you work with enterprises and rely on yearly invoices, it would be wise to test an invoice that adheres to the following best practices.
- You are 3X more likely to get paid if you add your logo to your invoice.
- If you include terms on your invoice, you are 1.5X more likely to get paid on time.
- You are 2x less likely to get paid if you include more than 4 people on the invoice.
Maxio invoices automatically follow the best practices laid out above, and you can test the efficiency of send dates and other factors as well.
Instead of invoices, you can use our tools to create flexible, usage-based subscriptions rather than invoices. It can be a way to secure cash flow and reduce potential payment delays and churn.
Deal with billing issues more efficiently
Billing issues are a significant problem for SaaS companies, and really, any company that charges a recurring subscription over credit cards.
But how do you deal with billing issues?
Transactions can fail when a customer’s credit card expires or when their balance is too low to complete the payment.
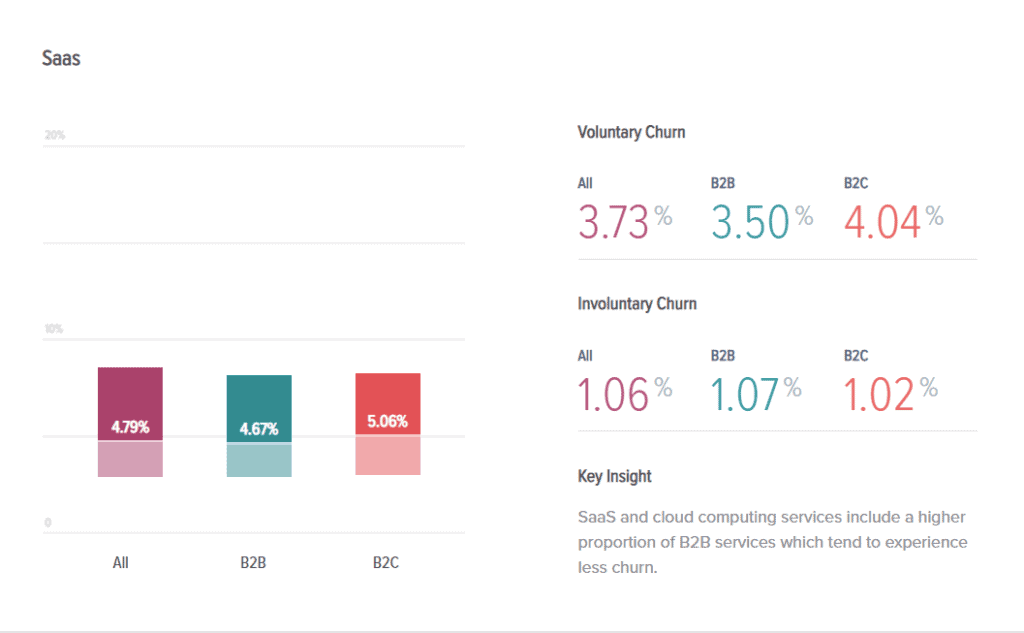
Over 20% of all SaaS churn is “involuntary churn,” which is caused by expired credit cards, failed payment attempts and other billing errors.
If you do nothing, at the average rate, you could lose 12% of your current subscriber base by the end of the year. That’s not something any business can afford.Of course, the right approach isn’t to do nothing — it’s to take action preemptively. Trying to deal with the problem after-the-fact is a last resort.
The answer to billing issues is automated dunning management and revenue retention. With pre-emptive campaigns, you can prompt customers to update their credit card information ahead of expirations.
You can also send automated follow-up emails after a failed payment before you cancel their subscription.

For many of our customers, just the dunning features alone pay for our fee many times over. Some clients have seen ROIs of up to 3,942%.
Get deeper insights into subscriber behavior and value
With detailed churn analytics and churn retention, you get deeper insights into the value of the subscribers you gain each month.
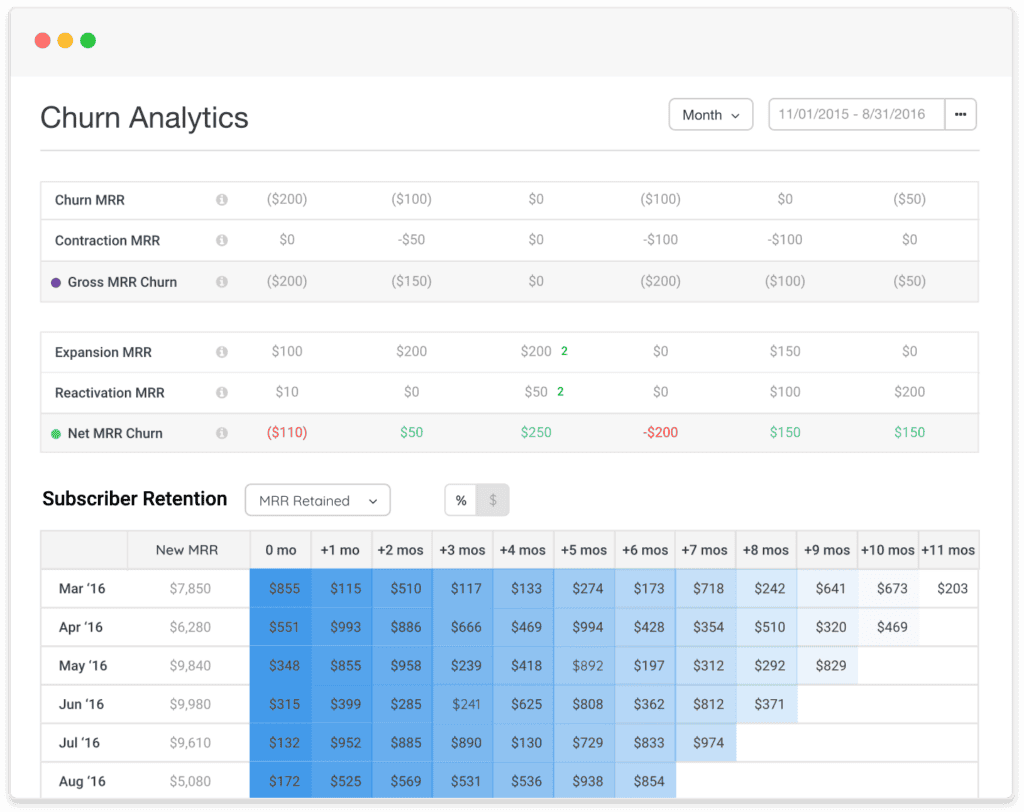
You can see the total generated revenue of any cohort of subscribers, including the retained MRR and any expansion revenue.
These reports can also help you trace higher or lower value customers back to limited promotions and marketing campaigns.
For example, if you notice that users who locked in their price during a Black Friday promotion have a higher CLTV, you might consider changing your prices.
With detailed churn analytics and churn retention, you get deeper insights into the value of the subscribers you gain each month.
You can see the total generated revenue of any cohort of subscribers, including the retained MRR and any expansion revenue.
These reports can also help you trace higher or lower value customers back to limited promotions and marketing campaigns.
For example, if you notice that users who locked in their price during a Black Friday promotion have a higher CLTV, you might consider changing your prices.
Final Thoughts
When measured and handled the right way, data shows the way forward in every area of your business. Pricing is no exception to that rule.
By keeping tabs on key metrics from product usage, sales and retention, combined with your knowledge of other efforts, you can get valuable insights into how your pricing model is performing, without resorting to unreliable surveys. (It’s easier to commit with words than with money.)
If you use the same growth-focused approach rooted in measurement, ideation and experimentation, which is the foundation of SaaS marketing, you will be able to deliver drive results with monetization optimization as well.
To access more complete data and comprehensive analytics for all your subscriptions and recurring revenue, schedule a call with one of our SaaS billing experts today.
