
Here, we’ll cover the basics you need to know about the dunning process in a SaaS model, including dunning management best practices.
In subscription-based SaaS businesses, failed payments are a common source of preventable revenue loss. Card expirations, bank declines, and billing errors can interrupt recurring charges and put active subscriptions at risk if they are not resolved quickly.
Dunning management addresses these billing failures through timely follow-ups that guide customers back to a successful charge. In a SaaS environment, this process is designed to protect SaaS recurring revenue while keeping customers subscribed. This guide explains how dunning fits into the SaaS billing cycle, why it matters for retention, and how teams use automation and payment recovery tools to reduce churn caused by payment issues.
Key takeaways
- Dunning management helps SaaS businesses handle failed payments before they lead to canceled subscriptions or lost revenue.
- Small billing issues like expired cards or declined payments are a common cause of churn, but they can often be fixed with timely reminders.
- A strong dunning process uses automation, retries, and follow-up messages to give customers clear chances to resolve payment issues.
- Clear rules, respectful communication, and flexible options help recover payments without damaging customer trust.
- When done well, dunning management improves revenue retention while keeping the customer experience intact.
What is dunning management?
Dunning management is the process SaaS businesses use to recover unsuccessful payments and unpaid invoices through structured customer communication. The term comes from the verb “dun,” meaning to repeatedly request payment.
Traditionally, dunning involves a series of payment reminders sent over a set period, starting with polite notices and becoming more firm if the balance remains unpaid. In some cases, this process can escalate to legal action.
In a SaaS context, dunning management focuses on recovering revenue while reducing churn. Automated reminders alert customers to failed payments, expired cards, or overdue invoices and prompt them to resolve issues before their subscription is paused or canceled.
Why dunning management is important for SaaS businesses
For subscription-based companies, automated dunning management helps recover revenue from billing failure while keeping customers subscribed and informed. Because SaaS relies on recurring billing, even small payment issues can disrupt accounts receivable and lead to lost revenue if they are not handled quickly.
Key benefits of SaaS dunning management include:
- Reduces involuntary churn: Automated payment retries and reminders give customers time to fix expired credit cards or declined payments before their subscription is canceled.
- Improves customer retention: Clear, timely payment messages help customers stay aware of billing issues and renewal timing, which supports higher renewal rates.
- Protects customer relationships: Dunning messages in SaaS are designed to be helpful rather than aggressive, which supports long-term trust.
- Encourages on-time payments: Regular billing reminders make it easier for customers to keep accounts current, improving cash flow.
- Reduces manual work: Automation handles most follow-ups, allowing teams to focus on customer support and growth.
- Surfaces payment insights: Dunning data helps identify common causes of unsuccessful payments so teams can reduce future billing issues.
Effective dunning management allows SaaS businesses to recover more revenue without harming the customer experience, supporting stronger retention and more predictable recurring revenue.
What does the dunning process involve?
The dunning process combines billing system logic and customer communication to prevent payment failures and recover overdue revenue. In SaaS, this process is designed to resolve issues early so subscriptions can continue without interruption.
- Emailing customers advance notifications of pending invoices to prompt timely payments.
- Inviting customers to update their payment information before subscriptions expire to avoid payment fails from expired or insufficient funds.
- Automatically retrying failed transactions after a set interval to allow customers to rectify declined cards or non-payment issues.
- Sending customers reminders to follow up on overdue invoices and overdue payments resulting from bad debt or other payment issues.
- Using a credit card updater service to automatically update expired card data, minimizing failed transactions.
By layering these tactics, SaaS companies give customers repeated opportunities to correct payment issues. This structured approach reduces revenue loss from failed transactions and lowers churn without adding friction to the customer experience.
Best practices for dunning management
Following these best practices can increase the efficiency of your dunning management strategy. Here are eight of the most important best practices to follow when executing your SaaS dunning strategy.
Prevent payment failures before they happen
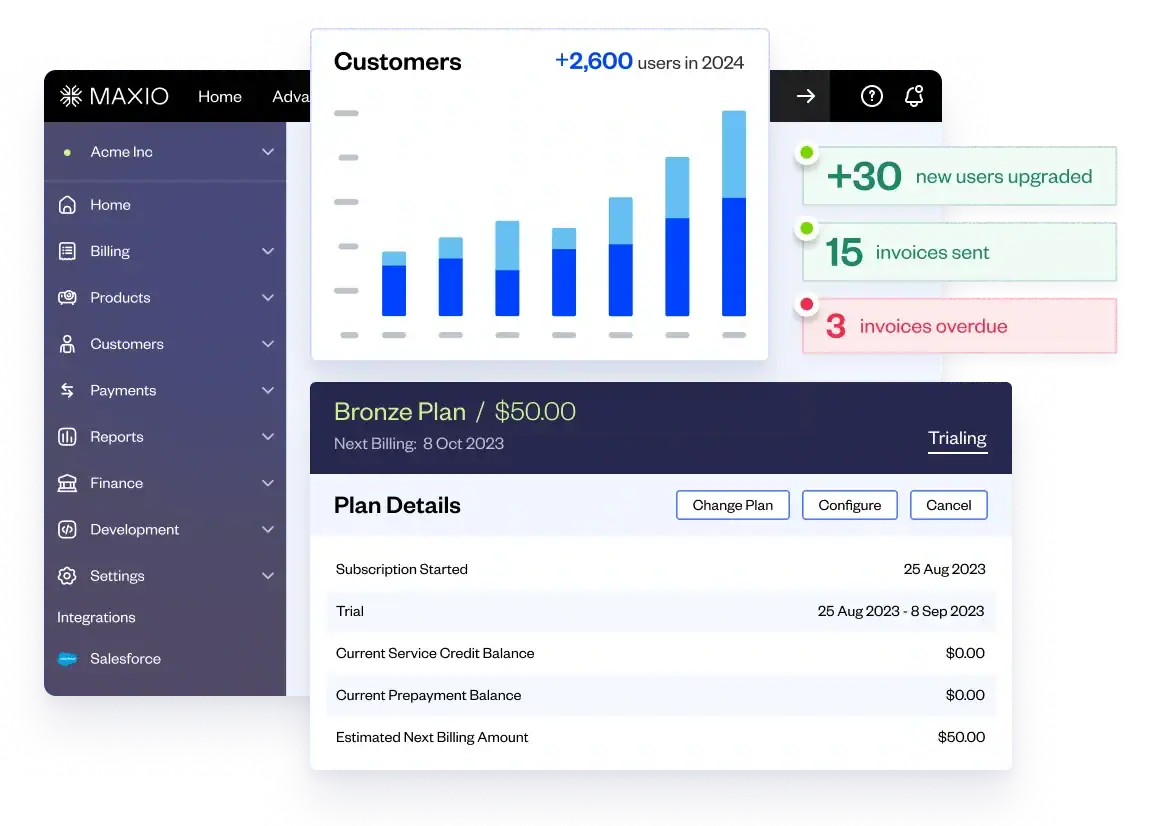
The foundation of a successful dunning strategy is taking steps to prevent accounts from going past due in the first place. Maxio’s interface provides out-of-the-box settings that let you take two important steps to keep card payments current and avoid declines:
- Card expiration email reminders prompt customers to update expired payment information before the next billing cycle. This prevents failed transactions from outdated or invalid payment methods.
- Payment reminder emails go out before each billing date so customers can update card information in case of issues. These payment reminders reduce the likelihood of non-payment and involuntary churn.
By keeping payment information current and sending proactive reminders, SaaS companies can avoid many of the failed payments and past due accounts that would otherwise end up in dunning flows. Fewer declines upfront mean less need for dunning follow-up on the back end.
Monitor any past-due accounts
Proactively monitoring accounts with overdue invoices and overdue payments allows you to focus dunning efforts on customers needing payment prompts. Maxio makes it easy to track which subscriptions have gone past due. You can filter by product, version, status, and other keywords to quickly see accounts with invoices past the due date.
This helps prioritize outreach to customers with the most substantial or long-overdue payments, minimizing involuntary churn from unpaid subscriptions. Staying on top of overdue payments is key for successful dunning management and maximizing the collection of revenue from existing customer accounts.
Strategize dunning policies
For cases where prevention strategies fail, you can plan what happens when a customer’s account has overdue payments. Develop policies within your dunning management system that outline the following:
- How long you’ll keep retrying cards before considering account cancellation
- How many dunning reminders you will send during the collection process
- What tone and messaging to use in email templates to balance customer satisfaction with recovering missed revenue
Your answers to these questions will help define standard operating procedures for your dunning workflows. This includes developing customized email templates for communicating with past-due customers in a way that encourages on-time payments while maintaining positive experiences. Defining these policies upfront allows automation to handle most first-level dunning communication so your team can focus on high-value customer account outreach.
Utilize multiple communication methods
Don’t rely solely on email templates for dunning outreach. Expanding to additional channels provides more opportunities to resolve late payments.
Some potential options include:
- SMS reminders when payments become past due, ensuring the requests don’t get lost in an overflowing email inbox
- Personal phone calls to delinquent higher-value customers, adding a human touch to understand issues and encourage updated payment
- Mailed letters or postcards to capture customers less likely to monitor digital messages
- Self-service customer portal highlighting overdue invoices, for a more passive communication channel
- Chatbots or interactive voice response providing automated payment prompts if agents aren’t available
While email dunning templates remain the easiest to scale, exploring other outreach methods can boost response rates. The specific channel mix will depend on your customer demographic, but offering multiple options caters to different communication preferences. This maximizes the likelihood that dunning requests are received and acted upon.
Consider your communication frequency
How frequently you send dunning reminders should align with the number of days before potentially canceling an account for non-payment. As a general best practice, aim to send at least two email notifications spaced apart as follow-up outreach before considering subscription cancellation.
For example, if your dunning management policy closes accounts after 60 days past due, you could send an initial email at 15 days overdue, another email at 30 days as a reminder, and a final notice at 45 days before closing the account. This allows sufficient follow-up attempts while still limiting excessive communication.
The ideal email frequency and total number sent will vary based on your payment terms, dunning timeline, and customer base.
Practice empathy in your messaging
Remember, your clients are people. Maintaining positive customer relationships and customer satisfaction should be prioritized, even during dunning communication. A personal phone call can be more effective than an email for delicately clearing up any payment issues or miscommunications. It adds a human touch to show you care about the customer as an individual, not just their payments.
Empathetic, constructive messaging helps preserve rapport while still addressing overdue invoices. Leading with empathy opens the door to finding cooperative solutions, rather than putting customers on the defensive. Combine compassionate outreach with flexibility in addressing individual customer circumstances, and your dunning process can strengthen loyalty and retention over the long term.
Provide opportunities for reactivation
Give customers opportunities to reactivate canceled subscriptions by updating billing information after payment fails. With Maxio, if a customer provides new credit card details before the final account cancellation, the system can immediately charge any overdue payments. This reactivates the subscription so it returns to an active state vs. proceeding to churn.
Allowing customers to rectify declined cards or expired billing data even after multiple payment fails gives one last chance to resume revenue streams. This reactivation potential further reduces involuntary churn that would otherwise result in permanent revenue loss. It’s a simple setting that pays dividends over time as more customers take advantage of the option.
Offer multiple payment options
Some customers cannot resolve overdue balances in a single payment. Offering flexible payment options creates additional paths to recovery.
This may include setting up payment plans that spread balances across multiple payments or switching to alternative payment methods such as bank transfers. Clear communication around payment options helps customers restore account standing while protecting recurring revenue.
Provide clear paths for resolving disputes
Some customers withhold payment due to billing errors, pricing questions, or unresolved support concerns. Clear dispute resolution policies help separate these cases from true non-payment.
Defined processes should explain how customers can report incorrect charges, request refunds, or flag issues that must be addressed before payment resumes. Making these paths easy to find and understand helps teams resolve problems faster, protect goodwill, and retain customer accounts that might otherwise churn.
Use AI and automation to optimize your dunning process
AI and automation improve dunning by reducing manual effort and improving decision-making. Historical payment data can be analyzed to identify accounts at higher risk of churn and track revenue metrics that show which timing or message types lead to better responses.
Automation handles routine actions like sending reminders, retrying failed payments, and flagging overdue accounts for review. This allows teams to focus on customer conversations and exceptions while the system manages consistent, rule-based dunning activity in the background.
Train staff in dunning communication
A successful dunning process and strategy relies on reps understanding how to effectively communicate with past due customers. Provide training to ensure staff have the skills to:
- Confirm billing details early and guide customers through account updates to prevent late payments
- Use empathetic language when discussing overdue invoices
- Suggest flexible payment arrangements based on the customer’s situation
- Address disputes related to billing errors or product issues
- Escalate complex cases when needed to protect the relationship
Clear guidelines around tone, repayment flexibility, dispute handling, and escalation help ensure consistency. With proper training, dunning conversations can resolve payment interruptions while keeping customer trust intact.
Use cases for dunning management
Once your dunning framework is in place, the next step is applying it to real billing scenarios. The following use cases highlight common situations where dunning management helps recover revenue and prevent subscription churn.
Card expiration emails
When a customer’s saved card is close to expiring, card expiration emails prompt them to update payment details before billing occurs. This helps avoid failed charges tied to outdated card information.
By addressing expiration issues ahead of time, these emails reduce preventable transaction failures and keep subscriptions from slipping into dunning due to technical issues.
Payment reminder emails
You can also enable payment reminder email notifications so that customers are notified three days before payments are due. This enables them to update credit card details before a billing attempt is made or a potential payment fails due to outdated billing info.
Payment reminder phone calls
Phone calls are useful when automated reminders are not enough or when an account requires more personal attention. Speaking directly with a customer helps uncover the reason behind a missed payment, whether it’s confusion, a billing concern, or a temporary issue.
Handled thoughtfully, phone outreach can resolve payment problems faster while preserving trust with higher-value or at-risk customers..
Late account SMS messages
Another strategy to incorporate within dunning management workflows is overdue payment SMS reminders. Automated text messages can provide friendly yet urgent prompts about late or missing payments on overdue invoices when customers are past their payment terms.
SMS dunning also has key advantages over email alone when trying to capture a customer’s attention and spur them to action. This is because text messages often get higher open and response rates thanks to real-time delivery to the customers’ mobile devices.
How to choose a dunning management software
Choosing the right dunning management software starts with understanding how payment failures affect your subscriptions and revenue. The best tools support recovery without creating friction for customers or extra work for your team.
When evaluating dunning software, look for the following:
- Flexible dunning rules and timing: The software should let you control retry schedules, reminder timing, cancellation thresholds, and escalation logic so dunning aligns with your billing policies.
- Support for multiple payment recovery methods: Look for features that handle card retries, payment method updates, and overdue invoice follow-ups without requiring manual intervention.
- Clear visibility into failed and past-due payments: Reporting and filtering tools should make it easy to identify at-risk accounts, understand why payments failed, and prioritize follow-up.
- Customer-friendly self-service options: Customers should be able to update payment details, resolve overdue balances, or reactivate subscriptions without contacting support.
- Automation with room for human intervention: The system should handle routine dunning actions automatically while allowing teams to step in for high-value or complex cases.
The right dunning management software supports consistent payment recovery while preserving customer relationships. By focusing on flexibility, visibility, and ease of use, SaaS teams can reduce involuntary churn and maintain predictable recurring revenue.
Automate dunning managementwith Maxio
Dunning management is one of the most effective ways for SaaS companies to recover revenue from billing failures and reduce overdue invoices. When handled correctly, it helps prevent churn caused by billing issues rather than customer intent.
To get the most value from dunning, best practices like automated card updates, payment reminders, and retry logic need to work together within a system designed to support them. Maxio’s subscription management and billing software brings these capabilities into a single platform, making it easier to automate dunning workflows while maintaining a positive customer experience.By combining automation with clear rules and flexible controls, teams can recover more revenue with less manual effort. Get a demo to see how Maxio supports effective dunning management at scale.