I recently presented on this topic at SaaS Metrics Palooza. If you’re prefer to watch the recording, you can view it here. Otherwise, read on!
We are not the first to say that “the days of growth at all cost are over.” However, we have the data to prove it for private companies.
According to our recent Maxio Growth Index report, which aggregates $15B of billing and invoicing data flowing over our platform for 2300 B2B SaaS companies, the market has shifted dramatically over the past 18 months (see below). In Q1 2022, B2B SaaS companies were still experiencing solid growth (30% YoY), and everyone was living high on the hog. I miss those days!
But we have seen a continued reduction in the overall growth rates since then. By Q1 2023, the growth rate for our customers (primarily Seed-Series C) had fallen to ~13%. And while that is bad, companies that are less than $1MM have really taken a hit over the last six quarters.

If you step back and think about it, this makes intuitive sense. Many of these early stage companies haven’t gotten product market fit yet, are running out of money, and their investors have closed the purse strings. How many of you have had investors say: “remember when I said you needed enough cash for 18 months? I was kidding: you need to make it last 36 months.” That is a BIG problem for people who raised money in 2020 and 2021.
Chelsea Stoner, our general partner at Battery Ventures, says this drop is worse than what she’s seen in her many years as an investor. She also pointed out that Battery is still finding companies who are achieving 100% YoY growth, so there are still winners out there.
Winning has just gotten a lot harder.
The Growth State for B2B SaaS Businesses
We’ve analyzed the billing data of over 2,100 B2B SaaS companies between 2022 and 2023—download the report to learn what we found.
The impact of growth efficiency on valuations
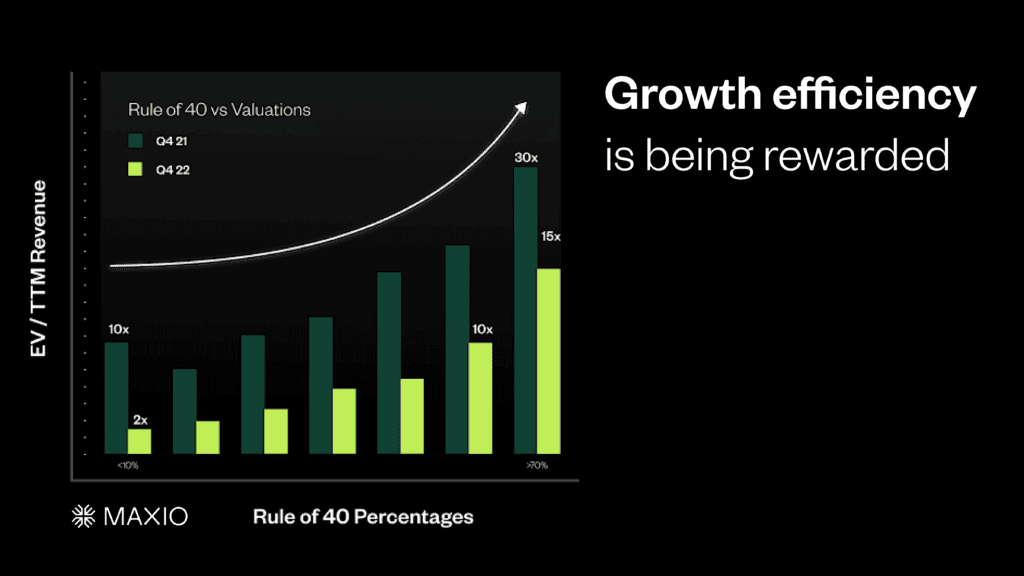
Growth efficiency is now being rewarded in the marketplace.
What does this mean?
Every CEO/CFO I’m talking to is starting to look closely at modulating their investment in GTM versus other areas of the business and are doubling down on the Rule of 40 (a combination of your growth rate and profit margins) as a measure of overall business performance.
Why?
Looking at the graph below, you see that in Q4 of 2021, you could have a 10x valuation with less than a 10% “Rule of 40 value.” But a year later, you had to have a “Rule of 40 value” greater than 60% percent to get a 10x valuation.
This means that investors are scrutinizing not just your growth rate, but also your profit margin. That’s why we talk about growth efficiency.
How to measure growth efficiency
At the highest level, growth efficiency can be measured by such things as CAC and magic number. However, to really understand the levers you can pull, you have to get to another level of detail in terms of understanding the costs to acquire/serve customers and run your business.
This can be a Herculean task unless you have a way to frame capture and represent these metrics in a consistent way. This is why, before we dig into the metrics that matter for growth efficiency, let’s lay the foundation for how you’ll track them: the Operating Metrics Scorecard.
The Operating Metrics Scorecard, popularized by Ben Murray of SaaS CFO, is a set of metrics grouped under five different categories from growth to retention to gross margin, profit, OPEX, and efficiency.
We use this exact scorecard to measure our performance at Maxio, and I recommend it to everyone who wants to get a better sense of what’s working in their business and what’s not.
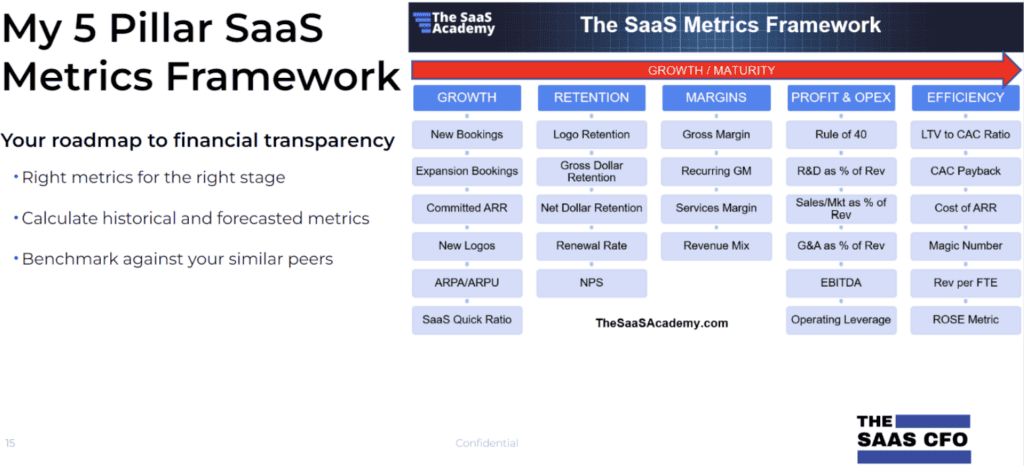
If you’re a really small company, Ben would tell you to just focus on the growth column. But as you’re starting to get some revenue in the door, you’ll want to shift your focus to the retention column metrics. As you reach the series B/C stage, you need to focus in on the gross margin.
Take a look at two example scorecards in the image below. Both are examples from companies that Ben worked with. The one on the left is doing well, as you can see from all the green on the board. This means they can hone in on the few areas that need more attention. In this case, it’s new bookings and gross logo retention. Hard problems to solve, but the overall business is still working.
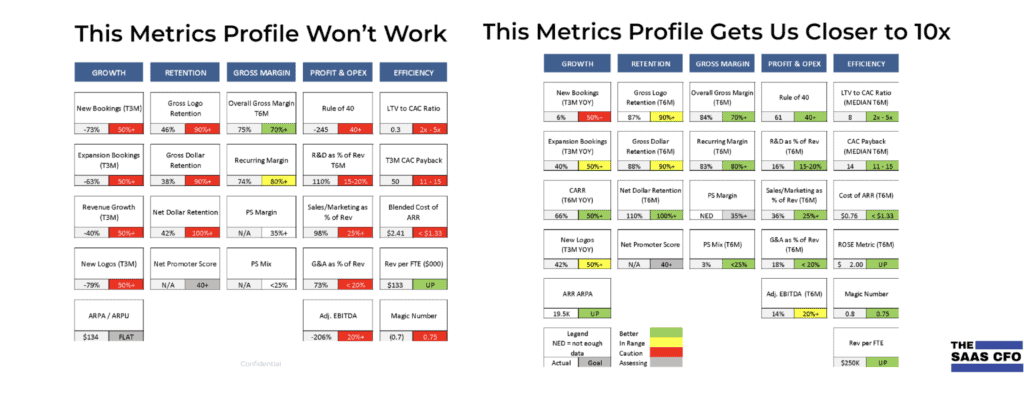
By contrast, the company on the right has very little going well when compared to their budget and the industry benchmarks. You would never hope to be in this position; however, if you are, you need to identify the systemic issues. Is it a product market fit issue? Did you overinvest in headcount, anticipating growth? To me, this looks like a restructuring scenario or, at the very least, a pivot scenario. This leads to a very different type of conversation with your board. You are going to need money, unless they provide you a convert or bridge loan. And you’re going to take a hit on valuation if you try to get another investor—maybe even a recap. Those are HARD conversations.
Your Operating Metric Scorecard is an incredible diagnostic tool, enabling you to
- Assess what is really going on in your business
- Focus on what needs it most
- Frame up conversations with your board about required investments and capital structure
The only two metrics that matter
When I stepped in as CEO at Maxio, I asked Chelsea about the metrics that mattered most to investors as we would not be able to focus on all 27 metrics that are included in the Operating Metrics Scorecard above.
She said there are really two engines that power winning tech companies:
- The cash engine
- The growth engine
The cash engine
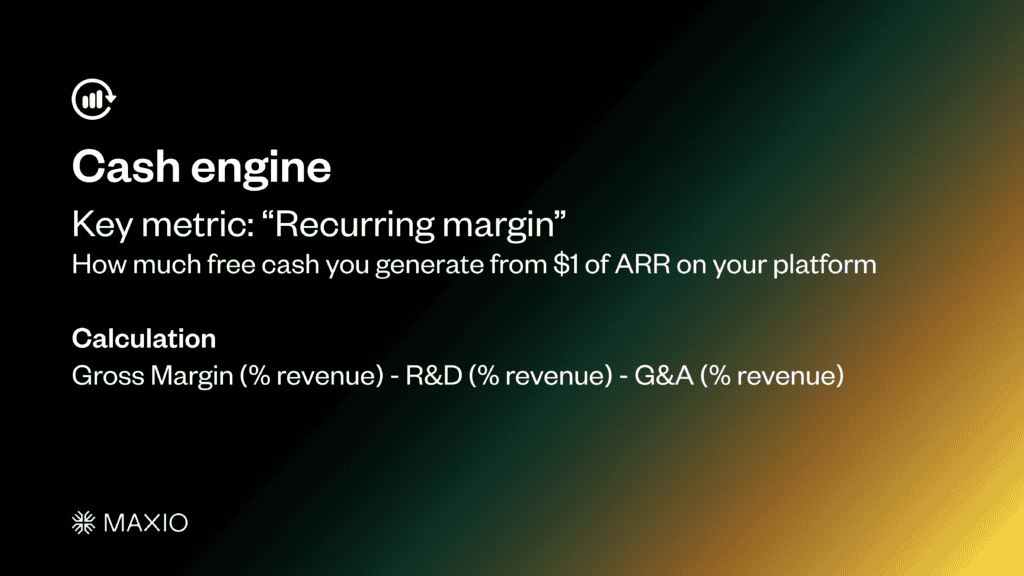
Your cash engine is measured by your recurring margin, which tells you how much free cash you generate from $1 of ARR.
It’s basically this: You’ve got to pay your cost of sales (aka COGS), which is reflected in your gross margin percentage, and you need R&D to build the product. Then you have G&A to maintain the system. Once you pay these costs, you will then have cash to invest.
Calculate this metric by subtracting R&D and G&A from your gross margin.
You now can decide where to invest that cash. Should it go into your growth engine, your bank, or to fund M&A?
The growth engine
Your growth engine is a growth efficiency metric which tells you: how much net new ARR do you gain per $1 of sales and marketing? This is the metric most of the people I am talking to are trying to tune when faced with the broader macroeconomic headwinds we are facing.
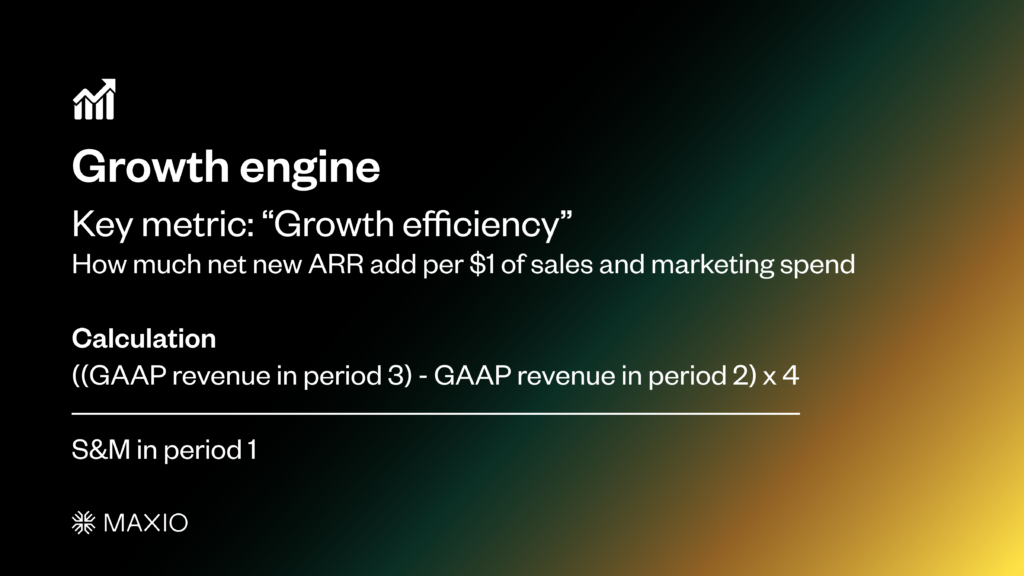
Calculating this metric is a bit more complicated than it sounds. It’s your GAAP revenue in one period minus the GAAP revenue of the previous period. In this case, we’re using a quarter. So, for this calculation, multiply by four and divide that by your sales and marketing costs in the period prior to when you would be driving the revenue.
It helps to split out your growth engine in terms of the net new ARR that’s coming from new customers and that which is coming from existing customers. This allows you to separate out the investments you’re making to acquire new customers versus grow current customers.
Using these metrics to frame conversations with your board will help you understand how the business model is working.
Ultimately, the conversation about your cash engine and growth engine resolves to a conversation about how much cash you need to generate given the market and your growth ambition: Are you generating enough cash from operations to fund growth? And what do you want to do with this cash in the short term and long term?
About the author
Randy Wootton is a GTM executive who has been helping marketing and sales tech companies develop and scale their SaaS capabilities for over 20 years, serving at companies like Percolate, Rocket Fuel, Maxio, and Salesforce. He’s a 3x SaaS CEO (public, private, VC- and PE-backed) and board member of multiple private companies.
Randy currently serves as CEO of Maxio, the leading provider of billing and financial operations solutions for high growth B2B SaaS companies.
