Business metrics show what’s really happening inside a business. They reveal whether growth is sustainable, where revenue is coming from, and which efforts are paying off, all using data instead of assumptions. Without the right metrics in place, teams risk making decisions based on incomplete or misleading information.

This guide walks through the most important metrics to track for growth, broken down by department and explained in clear, practical terms. You’ll see how each metric works, how it’s calculated, and why it matters, so you can focus on the numbers that support informed decision-making as your business scales.

Key takeaways

  • Business metrics turn activity into measurable insight, helping teams understand how the business is actually performing.
  • Tracking the right metrics reduces guesswork and supports better decisions across teams.
  • Not all metrics are KPIs, but KPIs help connect data directly to business goals.
  • Different departments rely on different metrics based on their role in growth.
  • Accurate, consistent data is essential for metrics to be useful and reliable.

What are business metrics?

Business metrics are numbers that show how a business is performing. They can track revenue, customers, operations, or marketing results based on business priorities.

Instead of relying on gut feelings, business metrics give clear proof of what’s working and what’s not. They turn daily activity into useful insights, making it easier to catch issues early and measure progress over time.

When used well, business metrics guide better decisions at every level. Leaders can set goals with confidence, teams can stay focused on the right priorities, and everyone has a shared way to measure success as the business grows.

Business metrics vs. key performance indicators(KPIs)

Business metrics give a broad view of what’s happening across the business, helping teams spot patterns and understand company performance, while key performance indicators (KPIs) are a smaller set of those metrics chosen because they tie directly to goals and results.

Metrics provide context and insight, but KPIs are used to measure progress against benchmarks and signal whether the business is moving in the right direction.

Why tracking business metrics matters

Tracking key business metrics matters because growth adds complexity and makes assumptions risky. Metrics give teams a clear view of what’s happening, so business decisions are based on facts, not instinct.

When metrics are tracked with intention, they help connect daily work to the overall business strategy.

  • Performance clarity: Metrics show how the business is performing across key areas, making gaps and wins easier to spot.
  • Smarter decisions: Reliable data helps leaders choose actions based on trends and results rather than opinions.
  • Team alignment: Shared metrics keep teams focused on the same priorities and reduce confusion around goals.
  • Measurable progress: Tracking the same metrics over time makes it easier to see improvement or decline.
  • Early issue detection: Metrics can reveal problems early, before they affect revenue or customers.

With a clear understanding of why metrics matter, the next step is deciding which ones are worth tracking in the first place.

How to choose the right business metrics

Choosing the right business metrics starts with focus. Tracking too many numbers can be just as unhelpful as tracking none at all. The goal is to pick metrics that clearly reflect how the business is performing and support the decisions you need to make as it grows.

A simple framework can help narrow your options and keep your metrics meaningful.

  1. Start with your goals: Choose metrics that connect directly to what the business is trying to achieve, not just what is easy to measure.
  2. Prioritize impact: Focus on metrics that influence decisions or signal meaningful change, rather than surface-level activity.
  3. Keep them actionable: Select metrics that point to clear next steps so teams can optimize performance when they move up or down.
  4. Limit the list: A small, focused set of metrics is easier to track, review, and use consistently in a dashboard.
  5. Review and adjust: As the business evolves, revisit your metrics to make sure they still reflect current priorities.

The metrics you choose should reflect how each team contributes to growth, which looks different from one department to the next.

Most important business metricsby department

Different teams track different performance metrics because each department plays a unique role in business growth. Organizing metrics by department makes it easier to focus on the numbers that matter most to each function while keeping the broader goals aligned across the business.

Sales metrics

Sales and revenue metrics focus on revenue performance and account-level results. They help sales teams understand how well efforts are converting into income and where growth is coming from over time.

1. Net sales revenue

Net sales revenue measures the income a business earns from sales after accounting for returns, refunds, and discounts.

How to calculate: Take total sales and subtract returns, allowances, and discounts.

Example: If a company earns $100,000 in total sales and issues $10,000 in refunds and discounts, its net sales revenue is $90,000.

2. Sales growth rate

Sales growth rate shows how sales change over time, indicating whether revenue is increasing or declining during a specific period.

How to calculate: Subtract sales from the earlier period from sales in the current period, divide the result by the earlier period’s sales, then multiply by 100.

Example: If sales were $80,000 last quarter and $100,000 this quarter, the sales growth rate is 25%.

3. Average revenue per account (ARPA)

Average revenue per account (ARPA) looks at how much revenue each customer account brings in on average over a given timeframe.

How to calculate: Divide total revenue by the number of active customer accounts during that period.

Example: If a business generates $50,000 in monthly revenue from 100 active accounts, the average revenue per account is $500.

Marketing metrics

Marketing metrics help marketing teams track how efficiently a business attracts, engages, and converts potential customers. These numbers show how well marketing efforts support sales and growth without overspending.

4. Customer acquisition cost(CAC)

Customer acquisition cost (CAC) reflects how much a business spends to gain a new customer through marketing and sales efforts.

How to calculate: Add total marketing and sales costs for a period and divide by the number of new customers acquired.

Example: If a company spends $20,000 on marketing and sales and acquires 100 new customers, its customer acquisition cost is $200.

5. Customer lifetime value(CLV)

Customer lifetime value (CLV) estimates the total revenue a business can expect from a customer over the length of their relationship.

How to calculate: Simple CLV estimate: Multiply average revenue per customer by average customer lifespan. More advanced versions may also factor in gross margin, churn, or profitability.

Example: If a customer generates $1,000 per year and stays with the company for five years, the customer’s lifetime value is $5,000.

6. Cost per lead (CPL)

Cost per lead (CPL) shows how much a business spends to generate a single qualified lead through a marketing campaign.

How to calculate: Divide total marketing spend by the number of leads generated.

Example: If a company spends $5,000 on a campaign and generates 250 leads, the cost per lead is $20.

7. Conversion rate

Conversion rate indicates the percentage of users who take a desired action, such as signing up, making a purchase, or filling out a form.

How to calculate: Divide the number of conversions by the total number of users or visitors, then multiply by 100.

Example: If 1,000 visitors result in 50 signups, the conversion rate is 5%.

Customer success metrics

Customer success metrics highlight how customers experience and stay with a business. They help teams measure satisfaction, loyalty, and long-term relationship health.

8. Customer retention rate

Customer retention rate shows the percentage of customers a business keeps over a specific period of time.

How to calculate: Divide the number of customers at the end of the period, excluding new customers acquired during that period, by the number of customers at the start of the period, then multiply by 100.

Example: If a company starts the month with 200 customers and ends with 180, the customer retention rate is 90%.

9. Net promoter score (NPS)

Net promoter score (NPS) reflects customer loyalty by measuring how likely customers are to recommend a business to others.

How to calculate: Subtract the percentage of detractors from the percentage of promoters based on survey responses.

Example: If 60% of respondents are promoters and 20% are detractors, the net promoter score is 40.

10. Customer satisfaction (CSAT)

Customer satisfaction (CSAT) captures customer experience by measuring how satisfied customers feel after an interaction, product use, or service experience.

How to calculate: Divide the number of positive responses by the total number of responses, then multiply by 100.

Example: If 80 out of 100 survey responses indicate satisfaction, the CSAT score is 80%.

11. Customer churn rate

Customer churn rate shows the percentage of customers who stop doing business with a company during a given period.

How to calculate: Divide the number of customers lost during the period by the number of customers at the start, then multiply by 100.

Example: If a company starts with 200 customers and loses 20, the customer churn rate is 10%.

Financial metrics

Financial metrics provide insight into profitability, cash flow, and overall financial health. They are used to evaluate stability and the business’s ability to grow responsibly.

12. Net income

Net income represents the amount of profit a business has left after all expenses, taxes, and costs have been deducted from total revenue.

How to calculate: Subtract total expenses from total revenue.

Example: If a company earns $150,000 in revenue and has $120,000 in total expenses, its net income is $30,000.

13. Gross profit margin

Gross profit margin shows how much revenue remains after covering the direct costs associated with producing goods or delivering services.

How to calculate: Subtract the cost of goods sold from total revenue, divide by total revenue, then multiply by 100.

Example: If a company earns $100,000 in revenue and has $60,000 in production costs, the gross profit margin is 40%.

14. Net profit margin

Net profit margin indicates how much profit a business keeps from each dollar of revenue after all expenses are accounted for.

How to calculate: Divide net income by total revenue, then multiply by 100.

Example: If a company earns $100,000 in revenue and has $15,000 in net income, the net profit margin is 15%.

15. Current ratio

Current ratio assesses a company’s ability to pay short-term obligations using its short-term assets.

How to calculate: Divide current assets by current liabilities.

Example: If a company has $50,000 in current assets and $25,000 in current liabilities, the current ratio is 2.

Human resources metrics

Human resources metrics focus on workforce stability, employee satisfaction, and productivity. These metrics help connect people-related trends to overall business performance.

16. Employee turnover rate

Employee turnover rate shows how often employees leave a company during a specific period.

How to calculate: Divide the number of employees who left during the period by the average number of employees, then multiply by 100.

Example: If 15 employees leave during the year and the company averages 150 employees, the employee turnover rate is 10%.

17. Employee net promoter score (eNPS)

Employee net promoter score (eNPS) reflects how likely employees are to recommend the company as a place to work.

How to calculate: Subtract the percentage of detractors from the percentage of promoters based on employee survey responses.

Example: If 50% of employees are promoters and 10% are detractors, the eNPS score is 40.

18. Revenue per employee

Revenue per employee shows how much revenue a business generates for each employee on average.

How to calculate: Divide total revenue by the total number of employees.

Example: If a company earns $2,000,000 in revenue and has 100 employees, revenue per employee is $20,000.

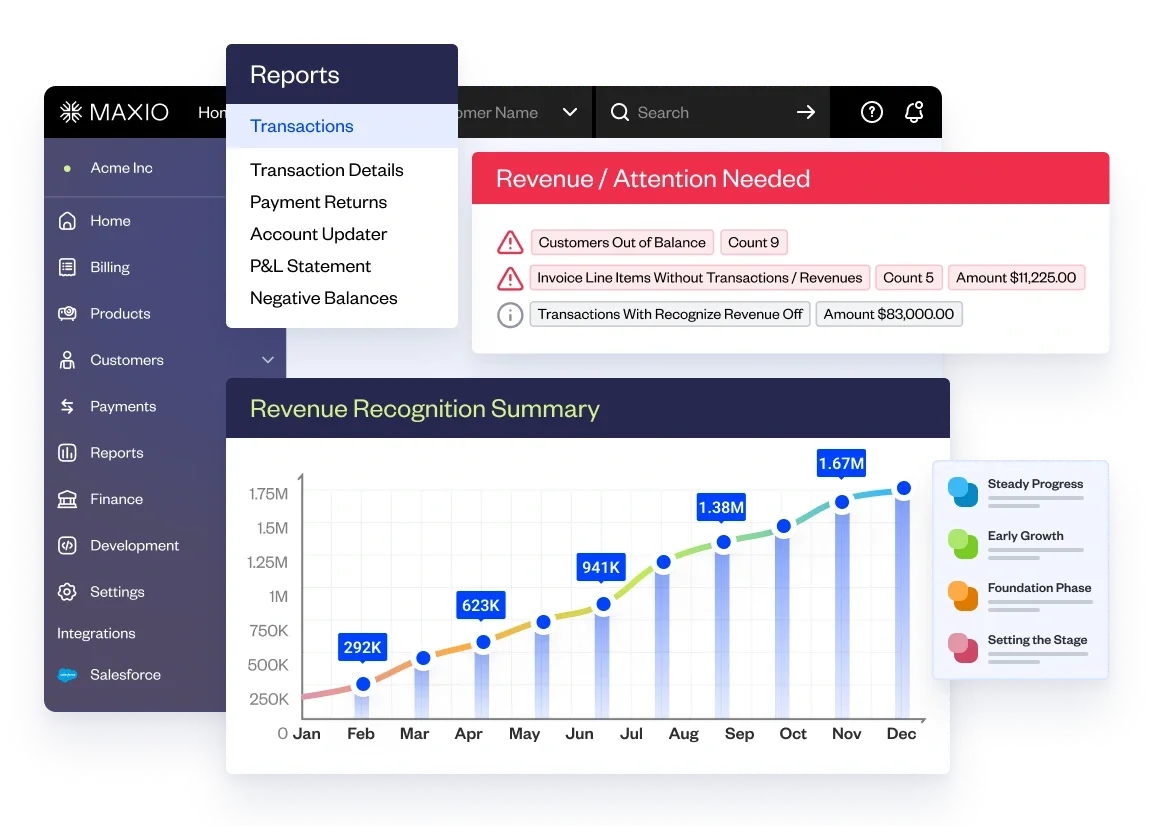
Track your business metrics accurately with Maxio

Tracking business metrics only works when the data behind them is accurate and reliable. Without clean, consistent data, even the right metrics can lead to the wrong conclusions and poor decisions.

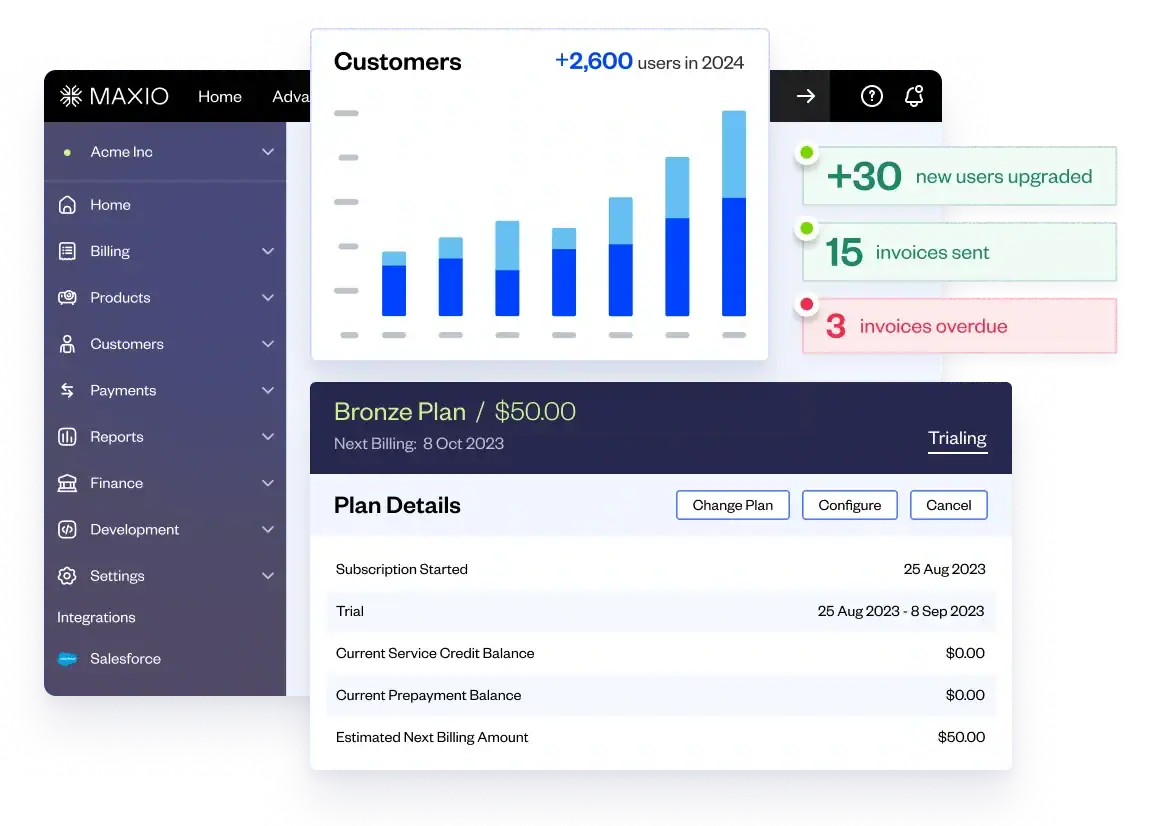
That’s where the right systems make a real difference. Maxio is a billing and revenue management platform designed for subscription and usage-based businesses that need dependable data as they scale. By bringing billing, payments, revenue recognition, and reporting into one place, Maxio removes guesswork and gives teams a clear view of revenue and customer activity.

Get a demo to see how Maxio helps teams track business metrics with confidence and make decisions based on numbers they can trust.

Revenue leakage represents a significant challenge for B2B SaaS companies, silently draining resources that could fuel expansion. When revenue slips away undetected, it limits an organization’s ability to invest in product development, scale operations, or support revenue generation. Addressing revenue leakage is imperative for maintaining financial stability and competitive positioning.

This article explores the primary causes of revenue leakage and presents practical solutions to stop it, helping protect your organization’s financial health and competitive positioning.

Key takeaways

  • Revenue leakage is unnoticed revenue loss from operational gaps in billing, contracts, and payment collection.
  • Measuring revenue leakage converts invisible losses into trackable data that justifies prevention investments.
  • Common causes include manual errors, billing inaccuracies, pricing misalignment, and inadequate payment collection tools.
  • Identify leakage through billing audits, payment analysis, system reconciliation, and contract compliance reviews.
  • Prevent leakage with standard operating procedures, automation tools, and systematic contract management.

What is revenue leakage?

Revenue leakage is unnoticed revenue loss caused by inefficiencies, errors, or mismanagement in financial processes.

While both impact your bottom line, revenue leakage differs from customer churn in an important way:

  • Churn tracks lost customers.
  • Revenue leakage pertains to lost revenue that could have been retained or earned.

Most revenue leakage comes from gaps in revenue operations. Manual work increases the chance of human error, and disconnected systems can cause mismatches between what was sold and what was billed. Without consistent tracking and oversight, these small losses can add up over time, shrinking profit margins and reducing the budget available for growth.

Importance of measuring revenue leakage

It is important to measure revenue leakage because you cannot fix what you cannot see. Measurement turns invisible losses into trackable data that drives recovery actions and protects cash flow.

Revenue leakage measurement provides three main benefits:

  1. Quantifies the problem: Measurement converts vague estimates into specific dollar figures that justify investment in prevention.
  2. Enables targeted fixes: Measurement shows where revenue leakage occurs, allowing teams to address root causes instead of guessing at solutions.
  3. Tracks performance over time: Regular monitoring identifies patterns and guides resource allocation to areas with the highest revenue recovery potential.

Common causes of revenue leakage

Revenue leakage stems from operational inefficiencies and breakdowns across billing, pricing, and data management. Understanding these causes helps organizations identify where to focus prevention efforts.

Human error in manual processes

Data entry mistakes in billing and invoicing processes lead to revenue loss. Manual processes create opportunities for errors like misentered invoice amounts or overlooked billing periods. Spreadsheet-based financial tracking compounds this problem, as errors propagate across linked processes and become difficult to trace.

Invoicing and billing errors

Incorrect invoices result in underbilling or overbilling customers. Underbilling loses revenue directly, while overbilling damages customer relationships and creates disputes that delay payment collection.

Pricing strategy misalignment

Ineffective pricing models fail to capture the full value of products or services. Misaligned pricing can leave potential revenue on the table by undercharging for product value, usage, or service scope.

Inadequate payment collection

Missing dunning management and subscription billing tools allow payment obligations to go unenforced. Without automated reminders and late fee structures, overdue payments accumulate and become harder to recover over time.

Incomplete or inaccurate reporting

Poor data quality leads to misinformed decisions about revenue performance. When financial reporting contains gaps or errors, teams cannot identify leakage sources or measure the effectiveness of prevention efforts. It’s important to find a SaaS reporting tool that keeps data accurate and consistent.

Inconsistent processes across teams

Lack of standardized procedures creates confusion and missed revenue opportunities. When sales, billing, and finance teams follow different workflows, revenue can fall through coordination gaps.

How to identify revenue leakage

Identifying revenue leakage requires systematic analysis of your revenue operations and financial data. Most leakage hides in the gaps between systems, in manual handoffs, and in processes that lack oversight and revenue assurance. Use these steps to uncover where your business is losing revenue.

  1. Audit your billing processes: Review your billing workflow from contract creation to SaaS payment collection. Look for discrepancies between contracted and billed amounts and unbilled services.
  2. Analyze payment collection rates: Calculate the percentage of invoices paid on time, late, or never collected, and compare it against accounts receivable aging to see where delays are building.
  3. Reconcile revenue across different systems: Compare data between your CRM, billing system, and accounting software. Mismatches indicate integration issues or manual entry errors that cause leakage.
  4. Review contract compliance: Check whether customers are being billed according to their contract terms. Look for pricing errors and earned revenue from services delivered but not invoiced.
  5. Track failed payment transactions: Monitor payment failures and their causes. Measure how many failed payments are successfully recovered through retry attempts.
  6. Examine revenue recognition timing: Verify that revenue is recognized when earned according to accounting standards. Delays in revenue recognition can mask leakage and hide operational problems.

Four ways to prevent revenue leakage

Preventing revenue leakage requires identifying weak points in your revenue operations and implementing controls to close them. These four strategies address the most common sources of leakage.

1. Identify sources of revenue leakage

Review your financial operations to pinpoint where revenue is escaping. Focus on these high-risk areas:

  • Billing system accuracy: Perform regular audits of your billing systems to catch discrepancies between contracted amounts and invoiced amounts.
  • Customer data quality: Maintain current customer information to prevent invoices from going to the wrong contacts or reflecting outdated pricing.
  • Sales team metrics: Monitor sales performance data to identify inconsistencies in deal structures or pricing that create downstream billing problems.
  • Forecasting and underbilling: Review revenue projections against actuals to identify systematic underbilling or missed revenue opportunities.

A practical method to validate leakage sources is to “staple yourself to an order.” Follow an order from sales through operations to accounting and cash receipt. This reveals where handoffs break down, and professional services are rendered but never invoiced.

2. Create and optimize SOPs

Documented standard operating procedures (SOPs) regulate processes and reduce inconsistencies. Developing SOPs involves analyzing current workflows, identifying gaps, and documenting every step. This organization shows you which levers to adjust in your revenue engine.

  • Process standardization: Uniform workflows across teams eliminate gaps where revenue can slip through.
  • Transparency: Clear processes make it easier to identify improvement areas and train new team members.
  • Consistency: Repeatable procedures produce reliable outcomes and catch errors before they cause revenue loss.
  • Informed decision-making: Well-documented SOPs ensure decisions align with organizational goals and are based on accurate information.

Integrating project management tools across systems can create dependencies that streamline workflows and strengthen revenue capture.

3. Leverage software automation tools

Automation reduces manual errors and helps prevent inaccurate billing by ensuring revenue processes execute consistently. Key automation areas include:

  • Contract lifecycle management: Automated alerts for renewals and compliance checks prevent contracts from expiring unbilled. Score contract quality based on cancellation terms, multi-year agreements, and contractual price increases to incrementally improve your contracted base value.
  • Recurring billing: Automated recurring billing cycles ensure invoices are generated on schedule with correct amounts, creating a clean billing process through streamlined workflows.
  • Subscription management: Efficient subscription management reduces missed renewals and ensures customers are billed correctly, maintaining consistent revenue streams.
  • Revenue recognition: Automation ensures revenue is recognized in the correct accounting periods according to standards, reducing manual errors and delivering accurate financial statements.
  • Revenue reporting: Real-time dashboards provide immediate insights into revenue performance, allowing you to identify trends at a high level and drill down to specific SaaS metrics and invoice details.
  • Revenue projections: Automated tools use historical data and analytics to create accurate cash flow forecasts that aid strategic planning and realistic goal-setting.

These tools optimize time tracking, streamline revenue management, and reduce reliance on error-prone manual spreadsheets.

4. Properly manage and execute contracts

Contract mismanagement creates significant revenue leakage. Proper contract management requires thorough reviews, ensuring all terms are met, and maintaining updated records. A robust CPQ solutions system prevents revenue leaks by ensuring terms are followed and discrepancies are addressed quickly.

  • Regular compliance reviews: Check that customers are being billed according to current contract terms, including price increases and volume commitments. Review contracts to identify and address discrepancies promptly.
  • Centralized records: Maintain accurate records of all contracts, including renewals, amendments, and terminations. This helps track contract performance and identify revenue leakage areas.
  • Renewal management: Monitor upcoming renewals to ensure timely processing and prevent service lapses that delay billing.

Effective contract management maximizes revenue opportunities and builds stronger customer relationships by ensuring all terms and conditions are met.

Prevent revenue leakage with Maxio

Preventing revenue leakage requires coordinated people, processes, and systems working together. By identifying leakage sources and implementing standard operating procedures, businesses create the foundation for consistent revenue capture. Automation tools then scale these processes to handle growing transaction volumes without introducing manual errors.

Maxio provides B2B SaaS companies with integrated solutions designed specifically to address revenue leakage. Our platform combines advanced billing automation with subscription management and automated revenue recognition, helping businesses optimize operations while maintaining financial accuracy.

Ready to stop revenue leakage in your business? Get a demo to see how Maxio can protect your revenue and streamline your financial operations. 

Revenue Recognition Policy Template

Auditors require lots of documentation to ensure accuracy. Having a solid revenue recognition policy in place is the first step toward ensuring compliance.

For most of the last decade, finance transformation has been defined by automation.

Across industries, finance teams invested heavily in tools and processes designed to eliminate manual work and reduce operational drag. That focus was necessary. Many teams were operating with systems that simply couldn’t scale alongside growing revenue complexity, new pricing models, or expanding customer bases.

Automating billing. Automating revenue recognition. Automating the close. For many finance teams, that work was long overdue and incredibly valuable. Automation reduced manual effort, lowered error rates, and gave teams back time they desperately needed.

But automation alone isn’t the end state.

Efficiency was the first milestone. Intelligence is the next one.

As businesses move faster, pricing models evolve, and expectations from boards and investors increase, finance leaders are being asked to do more than run efficient processes. They’re being asked to deliver insight. And that’s where the next frontier begins.

The shift underway isn’t from manual to automated. It’s from automated to intelligent.

Automation Solved Yesterday’s Problems

There’s no question automation has changed finance for the better.

Automated workflows have helped teams:

  • Close the books faster
  • Reduce spreadsheet dependency
  • Eliminate repetitive, error-prone tasks
  • Scale operations without adding headcount

For many organizations, automation was the difference between keeping up and falling behind.

But automation is fundamentally backward-looking. It’s designed to execute known processes more efficiently, not to help leaders see what’s coming next. Automated systems can tell you what happened faster, but they don’t necessarily tell you what it means, or what to do about it.

That gap is becoming more visible as businesses grow more complex, faster-moving, and more experimental in how they monetize and operate.

Why Intelligence Matters Now

Today’s CFOs operate in a very different environment than even a few years ago.

Pricing and packaging change more frequently. Contracts are more complex. Usage-based and hybrid models are becoming common. Stakeholders expect real-time visibility into performance, not explanations weeks after the fact.

In this environment, efficiency alone isn’t enough.

Finance leaders need the ability to:

  • Spot risks early, not after they hit the P&L
  • Understand trends as they emerge, not after the quarter closes
  • Model scenarios with confidence, not assumptions
  • Guide decisions with signals, not lagging indicators

That’s what intelligence provides. And it can’t be bolted on as an afterthought.

Intelligence isn’t something you switch on once processes are automated. It emerges when systems, data, and workflows are designed to support decision-making and not just execution.

The Limitation of Automating Fragmentation

Many finance teams have automated workflows without addressing a deeper issue: fragmentation.

This is where the conversation often overlaps with AI, but the issue exists even before intelligence enters the picture.

Revenue data often lives across CRM systems, billing platforms, revenue schedules, and general ledgers that don’t fully agree with each other. Contract changes don’t always flow cleanly downstream. Reporting metrics vary depending on who pulls them and when.

Automation can speed up individual steps inside those systems. It doesn’t resolve the gaps between them, however.

When data remains fragmented:

  • Forecasts depend on manual adjustments
  • Variance analysis requires reconciliation before insight
  • AI outputs raise as many questions as they answer

In other words, automation makes the machine run faster, but intelligence requires the machine to be connected.

Without connectivity, finance teams are left interpreting outputs instead of acting on insights. Speed increases, but clarity does not.

What Finance Intelligence Actually Looks Like

Finance intelligence isn’t about flashy dashboards or sophisticated models for their own sake. It’s about creating an operating environment where insight is a natural byproduct of how the business runs.

In an intelligent finance operation:

  • Revenue events flow cleanly from quote to billing to recognition
  • Changes propagate automatically instead of triggering downstream cleanup
  • Metrics are consistent by definition, not by effort
  • Forecasts update continuously as new signals arrive

This is where AI starts to matter not as a replacement for judgment, but as an amplifier of it.

The emphasis here isn’t on AI as a breakthrough, but on intelligence as a natural outcome of well-structured finance operations.

When the data foundation is solid, AI can help surface anomalies, highlight emerging trends, and maintain rolling forecasts that reflect reality instead of static snapshots.

The difference is subtle but important. Intelligence doesn’t just answer questions faster. It changes which questions finance leaders can ask in the first place. Finance moves from explaining what happened to helping shape what happens next.

From Scorekeeper to Navigator: How the CFO Role Evolves with Intelligence

As finance operations become more intelligent, the CFO role evolves as well.

CFOs are no longer measured only by how efficiently they close the books. In an intelligent finance organization, the CFO’s value increasingly shows up between reporting cycles, not just at the end of them. They’re measured by how confidently they guide the business through change. That means translating complexity into clarity and helping leaders make informed tradeoffs in real time.

This shift doesn’t diminish the importance of control or discipline. If anything, it raises the bar.

Intelligent finance requires:

  • Clear definitions and ownership of metrics
  • Governed, auditable data
  • Systems that can adapt as the business evolves

The CFO becomes less of a historian and more of a navigator, still accountable for accuracy, but increasingly responsible for insight and forward motion.

That role requires both discipline and flexibility: discipline in data governance and controls, and flexibility in how finance supports evolving business models.

Intelligence Follows Structure

There’s a temptation right now to look for intelligence in tools alone to assume that adding AI on top of existing systems will unlock better decisions.

In practice, intelligence follows structure.

Finance teams that get the most value from AI and advanced analytics are the ones that have already invested in connecting their systems and cleaning up their data. They’ve reduced reconciliation, standardized definitions, and created a single source of truth across the revenue lifecycle.

Without that foundation, intelligence doesn’t scale. It creates noise instead of clarity.

The organizations that struggle most with advanced analytics and AI aren’t lacking ambition. They’re constrained by systems that were never designed to work together.

The Advantage of Getting This Right

When finance leaders move beyond automation and build toward intelligence, the impact extends far beyond the finance team.

The business gains:

  • Faster, more confident decision-making
  • Earlier visibility into risks and opportunities
  • Stronger alignment between finance, sales, and operations
  • Greater credibility with boards and investors

Most importantly, finance becomes a proactive partner in growth instead of a reactive function trying to keep up.

When intelligence is embedded into finance operations, leaders spend less time explaining numbers and more time shaping strategy.

Building Toward the Next Frontier

The move from automation to intelligence isn’t about replacing systems overnight or chasing the latest trend. It’s about sequencing transformation deliberately.

Start by connecting the core systems that power revenue. Reduce fragmentation. Establish clean, governed data flows. Then layer intelligence on top of a foundation you trust.

That’s how finance evolves from efficient execution to strategic advantage.

At Maxio, that’s the world we’re building toward: helping finance teams unify billing, revenue recognition, and reporting so intelligence becomes part of how finance operates every day.

When systems are connected and data is trustworthy, finance leaders gain the confidence to move faster, experiment responsibly, and guide the business through change without losing control.

If you’re thinking about what the next phase of finance transformation looks like for your organization, you can request a Maxio demo to see how a connected finance stack supports intelligent, confident finance leadership as your business scales.

Invoice consolidation groups multiple charges into one billing document instead of issuing separate invoices for each transaction. This billing method changes how finance teams prepare statements and how customers receive and pay their bills.

The approach affects operational efficiency, customer relationships, invoice management, and payment processing across your business. Understanding when and how to implement consolidated invoicing helps you decide whether this billing structure fits your company’s needs and your customers’ preferences.

In this article, we’ll cover when consolidated invoicing makes sense for your business, the operational advantages it creates, real-world applications across different industries, implementation steps, and best practices for running consolidated billing over time.

Key takeaways

  • Consolidated invoices group multiple charges from the same time period into one document with a single payment deadline
  • This billing method reduces administrative work for finance teams while simplifying payments for customers
  • Businesses that bill the same customers multiple times per month see the most benefit from consolidation
  • Implementation requires connecting billing systems, setting grouping rules, and creating unified invoice templates
  • Automated consolidation platforms handle billing timing, payment coordination, subscription grouping, and mid-cycle adjustments without manual intervention

What is a consolidated invoice?

A consolidated invoice combines several charges from a set time period into one document. Instead of issuing separate invoices for each service or transaction, related charges are grouped.

The system pulls billing data and organizes it based on the criteria you choose, such as customer, project, billing period, or department. The final invoice lists all line items in one place with a single total amount due and one payment date. This works well for monthly billing cycles where charges happen at different points in the month but are easier for customers to handle when combined.

This method cuts down on the work involved in managing invoices and simplifies subscription and account oversight. Tracking one statement instead of many usually leads to faster payments. For businesses that provide recurring services or sell across different product lines, it also creates a clearer record of invoiced activity and makes account-level reconciliation easier from one accounting period to the next.

When consolidated invoicing makes sense

Consolidated invoicing works well in situations where separate invoices create extra steps, confusion, or unnecessary processing. It tends to be the better option when any of the following are true:

  • A single customer receives multiple invoices each month for different services, products, or locations, and a combined statement would reduce clutter.
  • Recurring billing cycles generate regular charges that can be grouped by month or quarter instead of being handled one at a time.
  • Clients maintain multiple accounts or subscriptions that share the same billing contact and payment terms.
  • Administrative teams spend significant time creating, sending, tracking, and reconciling invoices that could be processed together.
  • Customers have asked for simpler statements or expressed confusion about receiving separate invoices for related work.
  • Accounting teams struggle to match payments to the correct invoices when several charges are paid at once or spread across different statements.

Benefits of consolidated billing that support growth

Consolidated billing creates operational advantages that extend well beyond simply reducing paperwork. When you group related charges into single statements, you establish a more organized billing structure that benefits your internal teams and your customers.

Increased operational efficiency

Consolidated billing brings related charges into one place so teams spend less time preparing and managing invoices. Automating the grouping process cuts down on manual data entry and helps streamline the invoicing steps your team manages each cycle. Finance teams can process one statement instead of several individual invoices.

Clearer customer experience

A single invoice gives customers a complete view of their charges and when payment is due. They can use their preferred payment methods without sorting through multiple documents or tracking different due dates. Fewer statements also means fewer notifications, making it easier for customers to review and approve payments on their end.

Improved cash flow management

Combining charges into one invoice creates more consistent billing patterns and predictable cash flow. One payment due date is easier for customers to track, lowering the chance of missed payments. This consistency simplifies cash forecasting and helps finance teams identify late payments before they become problems.

Lower error rates

Keeping all charges in one document reduces the likelihood of discrepancies between statements. Line items pull from the same data source and stay linked to the correct accounts or projects. This consolidation lowers the chances of duplicate charges, incorrect amounts, or mismatched information that require time-consuming corrections. It also reduces the risk of missed invoices or overlooked subscription changes by centralizing billing activity in a single statement.

Easier invoice and subscription management

Consolidated billing helps accounting and finance teams manage invoices and related subscriptions more efficiently. Instead of tracking multiple open invoices across different services or billing dates, teams can oversee activity at the customer level. This simplifies invoice tracking, reduces follow-up work, and provides a clearer view of outstanding balances and active subscriptions.

Real-world invoice consolidation examples by industry

Billing can become complicated when charges come from different sources. Some businesses manage mid-cycle changes, others bill for project work, and many split charges across departments.

The examples below show how invoice consolidation brings these items into one clear statement.

SaaS and subscription businesses

A project management software company charges for subscription tiers, user seats, and storage. In one month, a 50-user account adds five additional users and extra storage, which leads to three separate invoices for the same billing period.

How it works: The billing system gathers every charge tied to the customer’s billing period and places them on one invoice. It lists the base subscription first, then the prorated cost for the five added users, followed by the storage upgrade as its own line item. All items share a single payment deadline.

The result: The customer receives one monthly invoice showing their complete account activity. They review their base plan, adjustments, and add-ons in a single document. The finance team only receives one payment and can easily track the customer’s active subscriptions and invoice status in one place.

Agencies and professional services

A digital marketing agency tracks 40 hours of strategy work, 25 hours of content production, $5,000 in ad spend, and $300 in stock photos for one client in one month. Each category typically generates its own invoice, creating four separate bills.

How it works: The billing system collects time entries and groups them by service type. Ad spend and expenses are added as separate line items. Everything appears on one invoice, organized by category.

The result: The client sees the full scope of work and costs in one document. The agency reduces the time spent generating multiple invoices. The client’s accounting team processes one payment instead of four and can more easily track invoice status.

Multi-product or multi-department companies

A business services company provides payroll processing, HR consulting, and benefits administration. Each department sends its own invoice, so clients with all three services receive three separate bills from the same vendor.

How it works: The billing system aggregates charges from all departments. Payroll shows per-employee fees, HR lists consulting hours, and benefits display management fees. All charges appear in clear sections on one invoice.

The result: Clients receive one statement showing total costs across all services. Internal departments follow the same billing process. The client’s accounting team processes one payment and reconciles one document more efficiently.

How to consolidate invoices

Moving to consolidated billing requires a structured approach that touches multiple parts of your finance operations.

Decide what should be consolidated

Identify which charges make sense to group. A consolidated invoice works best when charges share the same customer, billing period, or project. Consolidated billing typically groups charges by customer account, subscription, or time period to simplify oversight for your team and your customers.

Gather your billing data

Collect all charges within your chosen timeframe for each customer. Pull data from time tracking tools, subscription platforms, and sales records. Your billing process should capture complete information for each line item before consolidation begins.

Choose your consolidation method

Select an invoice solution that handles your consolidation needs. Some accounting software tools include built-in consolidation functionality, while others require integrations with third-party tools. Your choice depends on transaction volume and the level of automation you need.

Set clear billing and grouping rules

Establish consistent rules for how charges get grouped and when invoices are generated. Define criteria such as billing frequency, subscription alignment, or customer account numbers. Set standard due dates that align with your consolidation schedule so customers know when payment is required.

Create a unified invoice format

Design a comprehensive invoice template that accommodates all the charge types you need to include. The format should clearly separate different categories while maintaining a consistent structure that’s easy for customers to read and understand.

Sync and validate data across systems

Connect your billing systems to ensure data flows correctly into consolidated invoices. If you use an ERP system, configure it to pull information from relevant modules. Set up automated checks that flag missing data or duplicate entries before invoices are finalized.

Review for accuracy before sending

Check each consolidated invoice for completeness before it goes to the customer. Verify that all expected charges appear and amounts match source records. Review the line items to confirm accuracy and catch any issues before sending.

Best practices for better consolidated billing

Running consolidated billing effectively over time requires attention to system design and customer communication.

Support flexible billing rules

Your automated billing system should accommodate different customer needs without creating extra manual work. Some customers may need charges grouped by project, while others prefer grouping by department or service type. Build flexibility into your payment processing so you can adjust billing cycles, apply custom discounts, or align multiple subscriptions under one invoice without generating separate statements.

Use strong data integrations

Connect all systems that generate billable charges so data flows automatically into your consolidated invoices. Strong integrations between your CRM, project management tools, subscription platform, and accounting system eliminate manual data entry and reduce errors.

Build clear, consistent invoice templates

Design invoice templates that present charges and applicable taxes in a clean, easy-to-read format. Group charges by category and include enough detail so customers understand what they’re paying for without overwhelming them.

Provide customer self-serve tools

Give customers access to billing portals where they can view current and past invoices, download statements, and track payment history. Include features that let customers update payment methods or review subscription details tied to each consolidated invoice.

Maintain audit-ready billing records

Store complete records of every consolidated invoice, including all supporting documentation. Keep backup data that shows how charges were calculated, which source systems contributed to each line item, and any adjustments made before sending. Organized records make audits easier and help resolve customer disputes quickly by providing clear documentation of invoiced activity.

What to consider before implementing consolidated billing

Consolidated billing changes how your finance team operates and how customers interact with your invoices.

Consider the following factors:

  • System compatibility: Check whether your existing accounting software, ERP, or billing platform supports invoice consolidation.
  • Data quality: Consolidated invoices depend on accurate data from every system that tracks billable activities.
  • Customer communication: Some customers may prefer receiving detailed separate invoices rather than consolidated statements.
  • Internal workflow changes: Consolidation affects how your finance team prepares, tracks, and manages invoices and subscriptions.
  • Billing complexity: Evaluate how many charge types, departments, or service lines you need to consolidate.
  • Payment terms and timing: Determine whether consolidated billing will change when customers receive invoices or when payments are due.

Automate invoice consolidation with Maxio

Managing multiple subscriptions per customer shouldn’t mean juggling separate invoices, payment dates, and transaction fees every month.

Maxio makes it simple. With our subscription billing software, you can group related subscriptions and let our platform handle billing timing, payment coordination, and collection automatically.

With our invoice consolidation features, monthly and annual subscriptions can be combined into a single statement, mid-cycle changes can be processed separately, and charges from different renewal dates can roll into a single invoice without extra effort from your team. Your customers pay once per billing cycle with one clear statement and one due date, which reduces transaction fees and cuts down on payment follow-up. Your finance team gains a clearer view of invoices and subscription activity at the customer level without altering how revenue is recognized.

Ready to see how Maxio can simplify your billing process? Book a demo with our team today.

AI is quickly becoming part of the everyday conversation in finance.

Forecasting. Variance analysis. Anomaly detection. Scenario modeling. The promise is that AI will help finance teams move faster, see more clearly, and spend less time buried in manual work. And in many cases, that promise is real. AI has the potential to fundamentally change how finance operates.

But there’s a hard truth that often gets lost in the excitement:

AI doesn’t make finance smarter on its own. It simply reflects the quality of the systems underneath it.

If your finance stack isn’t connected, if your data isn’t clean, consistent, and governed, you can’t trust what AI tells you. And in finance, trust is everything.

AI Doesn’t Fix Broken Data. It Scales It

There’s an understandable assumption that AI will somehow “figure it out.” That it will reconcile inconsistencies, smooth over gaps, and magically turn messy data into insight.

That’s not how it works.

AI models are incredibly good at identifying patterns and extrapolating trends. But they don’t know which numbers are “right.” They don’t understand business context unless that context is embedded in the data itself. When you feed AI fragmented or conflicting inputs, it doesn’t correct them. It amplifies them.

If your CRM says one thing, your billing system says another, and your general ledger reflects a third version of reality, AI won’t resolve the disagreement. It will confidently analyze all three and give you an answer that looks authoritative and is fundamentally unreliable.

In finance, that’s a problem. Speed without accuracy doesn’t create advantage. It creates risk.

Fragmentation Is the Real Barrier to Intelligence

Most finance teams aren’t held back by a lack of effort or talent. They’re held back by fragmentation.

Revenue data lives across multiple systems. Contract changes don’t flow cleanly through billing. Usage data is difficult to reconcile with invoicing. Revenue recognition depends on manual intervention. Reporting metrics vary depending on who pulled them and when.

This fragmentation already makes closing the books harder than it needs to be. It slows down forecasting. It forces finance teams into constant reconciliation mode. It undermines confidence in the numbers — even when everyone is doing their best.

Now add AI to that environment.

Instead of spending time reconciling data manually, you’re reconciling AI outputs. Instead of debating assumptions in a forecast, you’re debating whether the forecast is grounded in reality at all. The work doesn’t go away, it just shifts.

AI exposes weaknesses in system design. It rewards companies that have invested in clean, connected infrastructure, and it punishes those that haven’t.

Finance-Grade AI Requires Finance-Grade Foundations

Finance isn’t like every other function. The bar is higher.

AI that supports finance decisions has to meet standards that go beyond speed or convenience. It needs to be explainable, auditable, and consistent. You need to understand not just what the answer is, but why it’s the answer.

That’s especially true as AI moves from being assistive to being more autonomous. When AI starts surfacing risks, flagging anomalies, or influencing decisions, finance leaders need to be able to trace every insight back to underlying transactions and rules.

That kind of trust doesn’t come from the AI layer. It comes from the data layer.

Until billing events, revenue schedules, contract changes, and reporting metrics are flowing from a single, connected source of truth, AI can’t reliably support the kinds of decisions finance teams are responsible for.

Why Trust Has to Come Before Automation

Finance teams have learned this lesson before: automating a broken process doesn’t fix it. It just helps you repeat mistakes faster.

AI follows the same rule.

Before you ask AI to forecast revenue or explain variance, you need confidence in the fundamentals:

  • Contracts reflect reality
  • Billing aligns with those contracts
  • Revenue recognition follows consistent rules
  • Metrics are derived from the same underlying data

Without that alignment, AI isn’t giving you foresight. It’s giving you false confidence.

That’s why so many AI initiatives in finance stall or disappoint. The technology works. The models work. The infrastructure underneath doesn’t.

What Changes When Systems Are Truly Connected

When finance systems are genuinely connected and not loosely integrated, not patched together with spreadsheets, the role of data changes.

Instead of being something you constantly reconcile, data becomes something you rely on.

In a connected finance stack:

  • Revenue events flow cleanly from quote to billing to recognition
  • Changes propagate automatically instead of triggering downstream clean-up
  • Reporting metrics are consistent by definition, not by effort
  • Close cycles shrink because fewer questions need to be answered manually

This is the environment where AI starts to deliver real value.

Now AI can:

  • Surface anomalies that actually matter
  • Identify trends early enough to act on them
  • Maintain rolling forecasts instead of static snapshots
  • Highlight risks before they turn into surprises

At that point, finance begins to shift from a system of record to a system of action — not because AI is “smarter,” but because the foundation is finally strong enough to support it.

The CFO’s Role Is Evolving Deliberately

CFOs today are expected to provide faster answers, deeper insight, and greater strategic guidance than ever before. That expectation didn’t start with AI, but AI has accelerated it dramatically. Boards want to understand performance in near real time. CEOs want forward-looking insight, not just explanations of what already happened. Investors expect confidence under scrutiny, even as business models and pricing grow more complex.

AI can absolutely help finance leaders meet those expectations. But only if it’s adopted thoughtfully, and only if the underlying systems are designed to support that speed and complexity.

For many CFOs, this represents a real shift in how the role is defined. Finance can no longer operate primarily as a reporting function that looks backward and reconciles after the fact. The role is moving toward something more dynamic: a continuous decision engine that helps the business see what’s coming, understand tradeoffs, and act with confidence.

That shift doesn’t happen by layering AI on top of yesterday’s workflows.

The temptation right now is to chase tools and features—to look for AI that promises instant insight or faster answers. But the more durable approach is to invest in infrastructure and operating discipline first. Intelligence follows structure. It doesn’t replace it.

That means CFOs have to be willing to step back and ask some uncomfortable but necessary questions:

  • Where does our revenue data actually originate, and how many times does it change before it reaches reporting?
  • How many versions of key metrics exist today across finance, sales, and operations?
  • What breaks or requires manual intervention when something changes mid-contract or mid-period?
  • How much of our close is true automation, and how much is cleanup driven by disconnected systems?

These aren’t academic questions. They determine whether AI becomes a strategic advantage or just another source of noise.

When finance leaders get this right, the payoff goes beyond efficiency. A connected, trustworthy foundation allows CFOs to move from reacting to results to shaping outcomes—to surface risks earlier, model scenarios with confidence, and guide the business through change instead of scrambling to explain it after the fact.

AI doesn’t eliminate the need for judgment or leadership in finance. If anything, it raises the bar. It forces clarity around definitions, ownership, and data integrity. And it puts the spotlight back where it belongs: on the CFO as the steady hand guiding the business forward, not just the one closing the books.

AI doesn’t eliminate the need to answer these questions. It forces them to the surface — and rewards the finance leaders who are willing to address them head-on.

The Quiet Winners of the AI Era

Over the next few years, AI in finance will be judged less on novelty and more on outcomes. Boards and investors won’t care how advanced your models are if the numbers don’t hold up under scrutiny.

The companies that succeed won’t necessarily be the loudest about AI. They’ll be the ones with:

  • Clean, connected financial data
  • Systems designed for change, not static assumptions
  • Confidence in their metrics, even as complexity grows

In those organizations, AI won’t feel like a separate initiative. It will simply be how finance operates.

Start With Trust

AI is becoming part of finance whether teams feel ready or not. The real question isn’t if you’ll use it. It’s whether you’ll trust it.

And trust doesn’t come from algorithms. It comes from foundations.

Connect the systems. Clean up the data. Build finance infrastructure that reflects how your business actually operates today,  not how it operated when pricing was simple, contracts were static, and reporting cycles moved more slowly.

When your finance stack is connected, AI stops being a source of uncertainty and starts becoming a genuine advantage. You can move faster without losing confidence, automate without introducing risk, and make decisions based on signals you actually trust.

If you’re thinking about how AI fits into your finance organization, the best place to start isn’t with a tool. It’s with your foundation.

That’s exactly what Maxio is built to provide. We help finance teams unify billing, revenue recognition, and reporting into a single, trusted system so when you’re ready to move faster and operate smarter, the data is already there.

If you’d like to see what that looks like in practice, you can request a Maxio demo and explore how a connected finance stack can support intelligent, confident finance operations as your business scales.

Managing financial health requires accurate data and reliable reporting. As companies grow, spreadsheets and manual exports slow down the close and make it harder to share trusted numbers. Financial reporting software connects to your accounting system, ERP, payroll, and billing tools to pull data automatically and produce consistent statements and dashboards.

This guide compares six financial reporting tools for 2026, including what each tool is best for, key features, pricing, and trade-offs.

Key takeaways

  • Financial reporting software pulls data from systems like accounting, ERP, payroll, and billing tools to create consistent statements, dashboards, and KPIs.
  • The biggest value is speed and accuracy: automated consolidation and validation reduce spreadsheet work, manual errors, and last-minute fixes during close.
  • The best tools connect easily to your existing stack, support custom report templates, and include audit trails, version control, and approval workflows.
  • The right platform depends on fit: general accounting tools work for basic statements, while subscription and multi-entity businesses need deeper revenue and consolidation features.
  • When comparing options, look at total cost and effort, including implementation time, ongoing admin needs, and trade-offs in flexibility or reporting depth.

What is financial reporting software?

Financial reporting software helps a business turn accounting and operational data into clear financial statements and reports. It connects to systems like your general ledgers, invoicing systems, payroll platforms, bank feeds, and ERP systems to extract transaction data and format it into standardized reports.

Most reporting tools generate statements and support custom reporting for budgets, profitability, and key financial metric KPIs. Because the data is connected and consistent, teams can compare results month over month or quarter over quarter without rebuilding spreadsheets.

At a basic level, the goal is simple: give finance teams a reliable way to produce accurate reports faster, with fewer last-minute fixes and fewer opportunities for errors.

Benefits of financial reporting software

Financial reporting solutions address common pain points in the close process while giving finance teams better tools to support informed decisions. Here’s how the right platform can improve your operations:

Streamlinefinancial data consolidation

Financial reporting software pulls data from multiple sources into a single platform, eliminating the need to manually gather information from different systems. This centralized approach supports invoice consolidation and gives you a unified view of your financial position, making it easier to analyze performance across departments, products, or regions.

Make data-driven decisionswith real-time insights

Access to current financial data means you can respond quickly to market changes and internal trends. Real-time dashboards and customizable reports deliver deeper insights so you can spot opportunities, drill down into issues as they emerge, and optimize financial performance.

Enhance accuracy and reduce manual errors

Automated data entry and built-in validation rules catch mistakes that typically slip through spreadsheet-based processes. The software performs calculations consistently and maintains an audit trail of all changes, reducing the risk of errors that can lead to costly corrections or compliance issues.

Saves time with automated reporting workflows

Templates and scheduled reports eliminate repetitive tasks that once consumed hours of your team’s time. Instead of rebuilding the same reports each period, you can configure them once and let your automated billing software generate updated versions automatically, freeing your staff to focus on analysis rather than data compilation.

Strengthen compliance and audit readiness

Built-in controls and documentation features help you maintain the records and processes required by regulatory standards. Reporting software tracks who accessed or modified financial data, stores supporting documentation alongside reports, and ensures calculations follow established accounting principles to support revenue recognition.

Key features to look for in financial reporting software

Not all financial reporting platforms offer the same capabilities. The features that matter most depend on your company’s size, industry, and reporting requirements.

When evaluating options, you should focus on features that address your specific reporting challenges. The following capabilities represent the core functionalities that deliver the most value for growing businesses:

  • Multi-source data integration: The software should connect directly to your other business applications to pull financial data automatically. This eliminates manual data transfers and keeps your reports current.
  • Customizable report templates: Look for the ability to create and save report formats that match your specific needs. Templates save time during setup, while customization options let you adapt reports as requirements change.
  • Version control and audit trails: Software should track every change to financial data, including who made it and when. This documentation supports financial audits and helps troubleshoot discrepancies.
  • Collaborative review workflows: The ability to route reports through approval chains keeps everyone aligned during the close process. Built-in collaboration reduces email back-and-forth and prevents confusion about current versions.
  • Data visualization and dashboards: Interactive charts and graphs make financial data more accessible to non-finance stakeholders. Visual formats help executives quickly grasp performance.
  • Flexible export and sharing options: The platform should let you export reports in multiple formats and share them securely with stakeholders. This ensures everyone can access information in their preferred format.

Top 6 financial reporting toolsin 2026

1. Maxio

Ideal for

B2B companies with subscription billing and complex revenue recognition needs.

Overview

Maxio is an all-in-one platform purpose-built for B2B SaaS financial operations. The platform combines subscription billing with revenue recognition and real-time reporting in one system. You get investor-grade analytics with over 30 pre-built reports covering ARR, MRR, churn, and LTV. Maxio automatically categorizes revenue into New, Expansion, Contraction, and Churn while handling mid-month changes and multi-year contracts. Finance teams close books faster while maintaining full audit readiness for GAAP and ASC 606 compliance.

Pros

  • Built-in subscription billing removes the need for separate invoicing tools
  • Pre-built SaaS metrics dashboards generate investor-ready reports automatically
  • Automated revenue recognition ensures ASC 606 compliance for multi-year contracts and usage-based pricing

Cons

  • Designed for B2B companies, so other business models may need different solutions
  • Enterprise-grade pricing may exceed budgets for very early-stage startups

2. QuickBooksOnline

Ideal for

Small businesses and early-stage companies that want simple financial reporting.

Overview

QuickBooks Online handles baseline financial reporting with income statements, balance sheets, and cash flow statements. The platform is widely adopted across small businesses, which makes it easy to find accountants and bookkeepers who already know the system. It works well for standard accounting tasks but lacks native support for subscription metrics or automated revenue recognition. QuickBooks offers a familiar interface and affordable pricing tiers that appeal to early-stage companies with straightforward reporting needs.

Pros

  • Accountants and bookkeepers typically already know how to use QuickBooks
  • Affordable pricing works for businesses with basic reporting needs
  • App marketplace offers add-ons for payroll, inventory, and time tracking

Cons

  • No built-in SaaS-specific metrics like ARR, churn rate, or cohort analysis
  • Subscription revenue recognition requires workarounds or third-party tools
  • Report customization becomes difficult as business models grow more complex

Integration with Maxio

QuickBooks Online connects directly to Maxio to automate journal entries and reduce month-end reconciliation work. The integration offers:

  • Automated Chart of Accounts syncing from QuickBooks to Maxio
  • Consolidated journal entries that flow from Maxio into QuickBooks at month-end
  • Linkbacks between systems for quick audit trail navigation

3. Xero

Ideal for

Small to medium-sized businesses that need cloud-based accounting with strong bank reconciliation and international capabilities.

Overview

Xero is a cloud accounting platform that covers the basics like bank reconciliation, invoicing, and expense tracking. It connects with thousands of banks and supports multiple currencies on higher-tier plans for international businesses. All plans include unlimited users, which is helpful for growing teams. Reporting is flexible with standard templates (P&L, balance sheet, cash flow), but SaaS metrics like ARR or customer churn typically require third-party tools.

Pros

  • Unlimited users on all plans accommodate growing teams
  • Automated bank reconciliation and transaction matching reduce manual data entry
  • Over 1,000 app integrations extend functionality for specific needs

Cons

  • Multi-currency support and advanced features require the highest-tier Established plan
  • No native subscription billing or automated revenue recognition for SaaS companies
  • Customer support responsiveness varies according to user reviews

Integration with Maxio

Xero connects directly to Maxio to sync billing and revenue data between platforms. The integration offers:

  • Automated syncing of customer contacts, invoices, and SaaS payments from Maxio to Xero
  • Configurable sync frequency: hourly, every 4 hours, or nightly
  • Revenue and liability account mapping ensures transactions post to the correct accounts in Xero

4. Vena Solutions

Ideal for

Mid-sized to enterprise companies with complex FP&A needs and finance teams heavily invested in Excel workflows.

Overview

Vena Solutions is an FP&A platform for financial planning, financial analysis, and reporting that works inside of Excel. It pulls data from tools like ERP, CRM, and HR systems, then adds controls Excel doesn’t have on its own, like version control and workflow approvals. Vena makes it so that teams can build custom reports and run what-if scenarios without leaving Excel. It also includes Vena Copilot, an AI assistant that answers finance questions using natural language.

Pros

  • Excel-native interface is easy for finance professionals familiar with spreadsheets
  • Pre-built templates and industry-specific solutions speed up setup
  • Workflow management includes audit trails that track changes and improve accountability

Cons

  • High pricing and implementation fees make it less suitable for smaller businesses
  • Performance slows when working with large datasets or complex models
  • Implementation often takes 3-6 months and requires dedicated resources and external consultants

5. OracleNetSuite

Ideal for

Mid-sized to enterprise companies needing a comprehensive ERP system with integrated financial management, inventory, and CRM capabilities.

Overview

Oracle NetSuite is a cloud-based ERP that brings together financials, inventory, and supply chain tools in one system. It supports core accounting and multi-subsidiary consolidation with multi-currency features for global teams. You also get customizable reports and role-based dashboards so you can track results by division, territory, or product. It’s built for companies that need a central system to run complex operations, not just bookkeeping. NetSuite Planning and Budgeting adds AI-powered forecasting and scenario planning.

Pros

  • ERP functionality consolidates multiple business systems into one platform
  • Multi-book accounting supports different reporting standards and tax codes
  • Multi-entity and multi-currency capabilities benefit international companies

Cons

  • High upfront costs with implementation fees often 2-3x the annual license cost
  • Complex setup requires specialized consultants and typically takes 4-6 months

Integration with Maxio

NetSuite integrates bidirectionally with Maxio to automate subscription billing and revenue recognition. The integration offers:

  • Automated syncing of customers, invoices, credit memos, payments, and refunds between systems
  • Maxio handles billing while NetSuite manages the general ledger and entity-level reporting
  • Real-time data flow eliminates manual entry and reduces implementation time

6. Datarails

Ideal for

Small to mid-sized finance teams that rely heavily on Excel and want to automate FP&A processes without changing their workflow.

Overview

Datarails is an Excel-native FP&A platform that automates budgeting and reporting while letting finance teams stay in their existing spreadsheets. It connects to ERP and accounting tools to pull data into Excel models automatically, reducing manual copy-paste work. Datarails also adds version control and workflow approvals, so teams don’t have to rebuild their models in a new system. It includes FP&A Genius, an AI assistant that answers finance questions, surfaces insights, and can generate presentation-ready reports.

Pros

  • Excel-native interface lets finance teams use familiar spreadsheets with added automation
  • AI-powered chatbot answers questions about financial data without manual analysis
  • Automatic data consolidation from multiple sources with real-time updates

Cons

  • Works only with Excel, not Google Sheets
  • Complex formulas can break when users without licenses edit models

How to choose the right financial reporting toolfor your business

Selecting the appropriate financial reporting tool depends on your company’s size, business model, and complexity of reporting. The software suitable for an early-stage startup may not fit a B2B SaaS company with multi-year contracts and intricate revenue recognition requirements.

Begin by assessing these factors:

  • Business model fit: If you’re running a subscription-based business, focus on tools that have built-in support for recurring revenue and SaaS metrics like ARR and MRR. Basic accounting platforms can handle simple reporting, but often need workarounds for subscription-specific needs.
  • Current system compatibility: Seek software that easily connects with your existing technology stack. The most effective reporting tools integrate with your ERP, CRM, and payment processors to avoid manual data entry.
  • Scalability needs: Think about where your business will be in two years. Software effective for 10 employees might become a bottleneck at 50. Pick a platform that can scale with your transaction volume and reporting needs.
  • Team skills and resources: Consider your finance team’s technical expertise. Some platforms require dedicated administrators or outside consultants for setup, while others enable faster deployment with less technical effort.
  • Reporting requirements: Match the tool to your actual reporting demands. For basic financial statements, simpler platforms are sufficient. For managing multiple entities or complex revenue rules, choose software designed for those challenges.
  • Budget factors: Account for both subscription fees and setup costs. Some tools tout low monthly fees but may entail high professional service expenses for implementation.

The ideal financial reporting tool should minimize manual work, boost accuracy, and free up your team for analysis.

Simplify financial reporting with Maxio

Financial reporting shouldn’t require piecing together multiple systems. Maxio combines subscription billing, automated revenue recognition, and investor-grade reporting in one platform built specifically for B2B SaaS companies.

Maxio’s SaaS reporting tools give you real-time visibility into ARR, MRR, churn, and cohort performance alongside standard financial statements. Our platform handles complex subscription scenarios while maintaining full ASC 606 compliance, so your finance team spends more time on strategy instead of data entry.

Ready to see how Maxio can transform your financial operations? Get a demo to discover how B2B companies use Maxio to close books faster and scale without adding finance headcount.

ATLANTA — Jan. 29, 2026 — Growth remains strong for B2B SaaS and AI companies, but  volatility is high, according to the B2B Growth Report by Maxio, a leading billing automation and revenue management platform. While the market is healthy overall, with the average company growing 18% year over year, more than 35% of companies experienced a decline, revealing an industry where growth increasingly depends on focus, discipline and execution rather than market momentum alone.

The report analyzed over $40 billion in billings data across 2,000+ companies from 2024-2025, revealing unexpected patterns in how growth varies by company size, business model, investment backing, and approach to AI. The findings challenge conventional assumptions about scaling thresholds, the universal benefits of AI adoption, and the predictability of growth trajectories.

“Growth didn’t disappear in 2025; it became harder to earn,” said Alan Taylor, Chief Operating Officer at Maxio. “The winners weren’t chasing every trend. Whether AI-native or traditional SaaS, the top performers stayed focused on solving real customer problems.”

Key Report Findings:

Growth is still the norm, but it’s not universal: Average company growth reached 18%, while aggregate market growth was closer to 13%, reflecting slower expansion among larger, more mature businesses. Nearly two-thirds of companies grew year over year, yet more than one-third declined. Down years remain common across all revenue bands.

Growth slows earlier than expected: The data revealed inflection points at around $5 million in billings with another slowdown beyond $25 million, not the typical $1 million, $10 million or $50 million marks, showing the operational challenges of scaling.

Vertical focus outperforms horizontal scale: Vertically focused companies grew faster than horizontal peers (20% vs 16%), reinforcing the value of specialization in competitive markets.

Capital helps, but doesn’t guarantee faster growth: Bootstrapped companies nearly matched VC-backed growth (20% vs. 22%), though scale differed dramatically with VC-funded companies nearly 4x larger. Private equity-backed companies focused more on profitability, growing 13% on average while skewing significantly larger than other cohorts.

AI accelerates, but only at the core: Truly AI-led companies, with AI central to product and positioning, grew fastest at 21%. However, AI-enhanced companies lagged at 16%, while non-AI companies quietly outperformed at 19%. This pattern suggests that AI adoption alone does not guarantee impact—AI implementation without clear value differentiation may not translate into competitive advantage.

“Average growth numbers only tell part of the story,” said Ray Rike, founder and CEO at Benchmarkit. “What stood out is how early growth friction shows up. Teams that identify where and why growth is accelerating will be best positioned to focus their resources on the market segments that provide faster growth.”

2026 Outlook

Despite a more competitive and complex environment, industry optimism is back and strong. Seventy-two percent of companies expect to grow faster in 2026 than 2025. However, leaders are entering the year with more measured expectations around buyer scrutiny, competition and the need for operational efficiency.

Sustainable growth is built, not assumed, the report found. Companies that understand their true growth levers, invest with intent, and maintain discipline as they scale will be best positioned to win in 2026.

To read the full B2B Growth Report, click here. 


About Maxio

Maxio is the billing and financial reporting platform trusted by over 2,000 SaaS, AI and subscription businesses worldwide. With $18B+ in billings under management, Maxio empowers finance teams to scale recurring revenue, automate quote-to-cash and deliver the insights needed to grow confidently. Learn more at maxio.com.

AI is changing the conversation in finance—but not in the way most people expect.

Instead of simply accelerating existing workflows, AI is exposing how finance data is structured, where systems break down, and whether insight can actually be trusted.

Much of the discussion focuses on models, tools, and features: what AI can automate, how fast it can analyze data, or which workflows it can replace. Those conversations aren’t wrong, but they miss the more important point. In finance, AI doesn’t create intelligence on its own. It depends entirely on the shape, consistency, and connectivity of the data underneath it.

That’s why some finance teams are seeing meaningful gains from AI today, while others are left with impressive demos that don’t translate into real decisions or confident action. The difference isn’t the sophistication of the AI. It’s whether the underlying finance data is unified.

AI Is Only as Good as the Data It Can See

At a technical level, this isn’t a new idea. Any system designed to analyze or predict outcomes depends on clean inputs. But finance data presents a unique challenge.

Revenue data is rarely housed in a single place. Customer records live in CRM systems. Contracts define commercial terms. Billing systems generate invoices and usage charges. Revenue schedules apply accounting rules. General ledgers roll everything up for reporting. Each system plays a role—but too often, they operate in partial isolation.

When those systems aren’t aligned, AI doesn’t fail loudly. It fails quietly—and that’s what makes the problem hard to spot.

Forecasts drift. Anomaly detection flags false positives. Trend analysis produces conflicting signals. The output looks polished, but finance teams still have to reconcile the answer before they can trust it. At that point, AI hasn’t removed work—it’s just shifted it.

Why Unified Data Changes the Equation

Unified finance data doesn’t just make reporting easier. It fundamentally changes what AI can do—and how useful it is to finance teams day to day.

When quote-to-cash data flows cleanly from CRM to billing to revenue recognition to the general ledger, every downstream analysis benefits. AI models no longer have to infer relationships between mismatched datasets. They operate on a coherent picture of how revenue is actually generated, billed, and recognized.

That coherence unlocks intelligence that isn’t possible in fragmented environments.

Instead of reconciling numbers, finance teams can focus on interpreting signals and making decisions while the information is still timely. Instead of debating which metric is correct, they can spend time understanding why it changed and what it means for the business.

Where AI Actually Delivers Value in Finance

When finance data is unified, AI becomes practical rather than theoretical. Some of the most impactful use cases aren’t flashy—they’re foundational.

Forecasting That Updates With Reality

Traditional forecasts are point-in-time exercises. They rely on historical data snapshots and manual assumptions, which quickly become outdated as deals change or usage patterns shift.

With unified data, AI can maintain rolling forecasts that update as new signals arrive—new bookings, contract changes, usage spikes, or churn indicators. The forecast doesn’t just move faster; it stays closer to reality.

Anomaly Detection That Finance Teams Can Trust

Anomaly detection is only useful when teams trust the baseline. In fragmented systems, AI often flags issues that turn out to be artifacts of timing differences or data mismatches.

Unified data removes much of that noise. When billing, revenue, and reporting are aligned, anomalies are more likely to reflect real issues—missed charges, contract misconfigurations, or unexpected usage behavior—rather than reconciliation artifacts.

Trend Analysis with Context

AI is excellent at spotting patterns, but patterns without context can be misleading—especially in revenue data, where timing, contract structure, and usage all matter. Unified data gives AI the context it needs: contract terms, pricing models, usage metrics, and revenue treatment all connected in one view.

That allows finance teams to distinguish between healthy growth, temporary spikes, and emerging risks—without stitching together multiple reports to get the full picture.

Why AI Struggles in Fragmented Finance Stacks

It’s tempting to assume that better or more advanced models will solve these problems. In practice, the limitations are structural.

When CRM, billing, and accounting systems aren’t connected:

  • AI has to reconcile differences before it can analyze trends
  • Forecast accuracy depends on manual overrides
  • Insights require explanation before they can drive action

In those environments, AI becomes an analytical layer that sits on top of broken workflows instead of reinforcing them. The result is intelligence that looks impressive but feels unreliable.

Unified data flips that dynamic. AI becomes embedded in the workflow rather than bolted on after the fact.

Intelligence Emerges from the System Design

One of the most common misconceptions about AI in finance is that intelligence is something you add on top of existing systems.

In reality, intelligence emerges from how systems are designed to work together.

When finance teams invest in unifying their revenue stack—connecting CRM, billing, revenue recognition, and reporting—they create the conditions where AI can operate continuously. Signals flow naturally. Metrics stay aligned. Insights don’t require translation.

In that environment, AI doesn’t replace human judgment. It supports it by surfacing patterns early, maintaining context, and reducing the manual work that slows decision-making.

What This Means for Finance Teams

For finance teams thinking about AI, the takeaway is straightforward but often overlooked: start with the data architecture, not the tooling.

Before asking what AI can do, ask:

  • Are our core revenue systems connected?
  • Do we have a single source of truth for key metrics?
  • Can changes flow through the system without manual cleanup?

If the answer to those questions is no, AI initiatives will struggle to deliver consistent value—no matter how advanced the tools are.

Building Toward Intelligent Finance Operations

The finance teams seeing the most value from AI aren’t chasing every new capability. They’re building toward a unified foundation that supports intelligence by design.

That’s where platforms like Maxio come in. By unifying billing, revenue recognition, and reporting, finance teams can create the clean, governed data flows that AI depends on. Intelligence becomes a natural extension of daily operations—not a separate project.

When data is unified, AI stops being a promise and starts becoming a practical advantage. Finance teams move faster, make better decisions, and spend less time questioning the numbers behind the insights.

If you’re exploring how AI fits into your finance organization, the most effective first step isn’t choosing a model or a tool. It’s unifying the data that powers your revenue lifecycle.

You can request a Maxio demo to see how a connected finance stack supports intelligent, data-driven finance operations as your business scales.

Here, we’ll cover the basics you need to know about the dunning process in a SaaS model, including dunning management best practices.

In subscription-based SaaS businesses, failed payments are a common source of preventable revenue loss. Card expirations, bank declines, and billing errors can interrupt recurring charges and put active subscriptions at risk if they are not resolved quickly.

Dunning management addresses these billing failures through timely follow-ups that guide customers back to a successful charge. In a SaaS environment, this process is designed to protect SaaS recurring revenue while keeping customers subscribed. This guide explains how dunning fits into the SaaS billing cycle, why it matters for retention, and how teams use automation and payment recovery tools to reduce churn caused by payment issues.

Key takeaways

  • Dunning management helps SaaS businesses handle failed payments before they lead to canceled subscriptions or lost revenue.
  • Small billing issues like expired cards or declined payments are a common cause of churn, but they can often be fixed with timely reminders.
  • A strong dunning process uses automation, retries, and follow-up messages to give customers clear chances to resolve payment issues.
  • Clear rules, respectful communication, and flexible options help recover payments without damaging customer trust.
  • When done well, dunning management improves revenue retention while keeping the customer experience intact.

What is dunning management?

Dunning management is the process SaaS businesses use to recover unsuccessful payments and unpaid invoices through structured customer communication. The term comes from the verb “dun,” meaning to repeatedly request payment.

Traditionally, dunning involves a series of payment reminders sent over a set period, starting with polite notices and becoming more firm if the balance remains unpaid. In some cases, this process can escalate to legal action.

In a SaaS context, dunning management focuses on recovering revenue while reducing churn. Automated reminders alert customers to failed payments, expired cards, or overdue invoices and prompt them to resolve issues before their subscription is paused or canceled.

Why dunning management is important for SaaS businesses

For subscription-based companies, automated dunning management helps recover revenue from billing failure while keeping customers subscribed and informed. Because SaaS relies on recurring billing, even small payment issues can disrupt accounts receivable and lead to lost revenue if they are not handled quickly.

Key benefits of SaaS dunning management include:

  • Reduces involuntary churn: Automated payment retries and reminders give customers time to fix expired credit cards or declined payments before their subscription is canceled.
  • Improves customer retention: Clear, timely payment messages help customers stay aware of billing issues and renewal timing, which supports higher renewal rates.
  • Protects customer relationships: Dunning messages in SaaS are designed to be helpful rather than aggressive, which supports long-term trust.
  • Encourages on-time payments: Regular billing reminders make it easier for customers to keep accounts current, improving cash flow.
  • Reduces manual work: Automation handles most follow-ups, allowing teams to focus on customer support and growth.
  • Surfaces payment insights: Dunning data helps identify common causes of unsuccessful payments so teams can reduce future billing issues.

Effective dunning management allows SaaS businesses to recover more revenue without harming the customer experience, supporting stronger retention and more predictable recurring revenue.

What does the dunning process involve?

The dunning process combines billing system logic and customer communication to prevent payment failures and recover overdue revenue. In SaaS, this process is designed to resolve issues early so subscriptions can continue without interruption.

  • Emailing customers advance notifications of pending invoices to prompt timely payments.
  • Inviting customers to update their payment information before subscriptions expire to avoid payment fails from expired or insufficient funds.
  • Automatically retrying failed transactions after a set interval to allow customers to rectify declined cards or non-payment issues.
  • Sending customers reminders to follow up on overdue invoices and overdue payments resulting from bad debt or other payment issues.
  • Using a credit card updater service to automatically update expired card data, minimizing failed transactions.

By layering these tactics, SaaS companies give customers repeated opportunities to correct payment issues. This structured approach reduces revenue loss from failed transactions and lowers churn without adding friction to the customer experience.

Best practices for dunning management

Following these best practices can increase the efficiency of your dunning management strategy. Here are eight of the most important best practices to follow when executing your SaaS dunning strategy.

Prevent payment failures before they happen

The foundation of a successful dunning strategy is taking steps to prevent accounts from going past due in the first place. Maxio’s interface provides out-of-the-box settings that let you take two important steps to keep card payments current and avoid declines:

  1. Card expiration email reminders prompt customers to update expired payment information before the next billing cycle. This prevents failed transactions from outdated or invalid payment methods.
  2. Payment reminder emails go out before each billing date so customers can update card information in case of issues. These payment reminders reduce the likelihood of non-payment and involuntary churn.

By keeping payment information current and sending proactive reminders, SaaS companies can avoid many of the failed payments and past due accounts that would otherwise end up in dunning flows. Fewer declines upfront mean less need for dunning follow-up on the back end.

Monitor any past-due accounts

Proactively monitoring accounts with overdue invoices and overdue payments allows you to focus dunning efforts on customers needing payment prompts. Maxio makes it easy to track which subscriptions have gone past due. You can filter by product, version, status, and other keywords to quickly see accounts with invoices past the due date. 

This helps prioritize outreach to customers with the most substantial or long-overdue payments, minimizing involuntary churn from unpaid subscriptions. Staying on top of overdue payments is key for successful dunning management and maximizing the collection of revenue from existing customer accounts.

Strategize dunning policies

For cases where prevention strategies fail, you can plan what happens when a customer’s account has overdue payments. Develop policies within your dunning management system that outline the following:

  • How long you’ll keep retrying cards before considering account cancellation
  • How many dunning reminders you will send during the collection process
  • What tone and messaging to use in email templates to balance customer satisfaction with recovering missed revenue

Your answers to these questions will help define standard operating procedures for your dunning workflows. This includes developing customized email templates for communicating with past-due customers in a way that encourages on-time payments while maintaining positive experiences. Defining these policies upfront allows automation to handle most first-level dunning communication so your team can focus on high-value customer account outreach.

Utilize multiple communication methods

Don’t rely solely on email templates for dunning outreach. Expanding to additional channels provides more opportunities to resolve late payments.

Some potential options include:

  • SMS reminders when payments become past due, ensuring the requests don’t get lost in an overflowing email inbox
  • Personal phone calls to delinquent higher-value customers, adding a human touch to understand issues and encourage updated payment
  • Mailed letters or postcards to capture customers less likely to monitor digital messages
  • Self-service customer portal highlighting overdue invoices, for a more passive communication channel
  • Chatbots or interactive voice response providing automated payment prompts if agents aren’t available

While email dunning templates remain the easiest to scale, exploring other outreach methods can boost response rates. The specific channel mix will depend on your customer demographic, but offering multiple options caters to different communication preferences. This maximizes the likelihood that dunning requests are received and acted upon.

Consider your communication frequency

How frequently you send dunning reminders should align with the number of days before potentially canceling an account for non-payment. As a general best practice, aim to send at least two email notifications spaced apart as follow-up outreach before considering subscription cancellation.

For example, if your dunning management policy closes accounts after 60 days past due, you could send an initial email at 15 days overdue, another email at 30 days as a reminder, and a final notice at 45 days before closing the account. This allows sufficient follow-up attempts while still limiting excessive communication.

The ideal email frequency and total number sent will vary based on your payment terms, dunning timeline, and customer base.

Practice empathy in your messaging

Remember, your clients are people. Maintaining positive customer relationships and customer satisfaction should be prioritized, even during dunning communication. A personal phone call can be more effective than an email for delicately clearing up any payment issues or miscommunications. It adds a human touch to show you care about the customer as an individual, not just their payments.

Empathetic, constructive messaging helps preserve rapport while still addressing overdue invoices. Leading with empathy opens the door to finding cooperative solutions, rather than putting customers on the defensive. Combine compassionate outreach with flexibility in addressing individual customer circumstances, and your dunning process can strengthen loyalty and retention over the long term.

Provide opportunities for reactivation

Give customers opportunities to reactivate canceled subscriptions by updating billing information after payment fails. With Maxio, if a customer provides new credit card details before the final account cancellation, the system can immediately charge any overdue payments. This reactivates the subscription so it returns to an active state vs. proceeding to churn.

Allowing customers to rectify declined cards or expired billing data even after multiple payment fails gives one last chance to resume revenue streams. This reactivation potential further reduces involuntary churn that would otherwise result in permanent revenue loss. It’s a simple setting that pays dividends over time as more customers take advantage of the option.

Offer multiple payment options

Some customers cannot resolve overdue balances in a single payment. Offering flexible payment options creates additional paths to recovery.

This may include setting up payment plans that spread balances across multiple payments or switching to alternative payment methods such as bank transfers. Clear communication around payment options helps customers restore account standing while protecting recurring revenue.

Provide clear paths for resolving disputes

Some customers withhold payment due to billing errors, pricing questions, or unresolved support concerns. Clear dispute resolution policies help separate these cases from true non-payment.

Defined processes should explain how customers can report incorrect charges, request refunds, or flag issues that must be addressed before payment resumes. Making these paths easy to find and understand helps teams resolve problems faster, protect goodwill, and retain customer accounts that might otherwise churn.

Use AI and automation to optimize your dunning process

AI and automation improve dunning by reducing manual effort and improving decision-making. Historical payment data can be analyzed to identify accounts at higher risk of churn and track revenue metrics that show which timing or message types lead to better responses.

Automation handles routine actions like sending reminders, retrying failed payments, and flagging overdue accounts for review. This allows teams to focus on customer conversations and exceptions while the system manages consistent, rule-based dunning activity in the background.

Train staff in dunning communication

A successful dunning process and strategy relies on reps understanding how to effectively communicate with past due customers. Provide training to ensure staff have the skills to:

  • Confirm billing details early and guide customers through account updates to prevent late payments
  • Use empathetic language when discussing overdue invoices
  • Suggest flexible payment arrangements based on the customer’s situation
  • Address disputes related to billing errors or product issues
  • Escalate complex cases when needed to protect the relationship

Clear guidelines around tone, repayment flexibility, dispute handling, and escalation help ensure consistency. With proper training, dunning conversations can resolve payment interruptions while keeping customer trust intact.

Use cases for dunning management

Once your dunning framework is in place, the next step is applying it to real billing scenarios. The following use cases highlight common situations where dunning management helps recover revenue and prevent subscription churn.

Card expiration emails

When a customer’s saved card is close to expiring, card expiration emails prompt them to update payment details before billing occurs. This helps avoid failed charges tied to outdated card information.

By addressing expiration issues ahead of time, these emails reduce preventable transaction failures and keep subscriptions from slipping into dunning due to technical issues.

Payment reminder emails

You can also enable payment reminder email notifications so that customers are notified three days before payments are due. This enables them to update credit card details before a billing attempt is made or a potential payment fails due to outdated billing info.

Payment reminder phone calls

Phone calls are useful when automated reminders are not enough or when an account requires more personal attention. Speaking directly with a customer helps uncover the reason behind a missed payment, whether it’s confusion, a billing concern, or a temporary issue.

Handled thoughtfully, phone outreach can resolve payment problems faster while preserving trust with higher-value or at-risk customers..

Late account SMS messages

Another strategy to incorporate within dunning management workflows is overdue payment SMS reminders. Automated text messages can provide friendly yet urgent prompts about late or missing payments on overdue invoices when customers are past their payment terms.

SMS dunning also has key advantages over email alone when trying to capture a customer’s attention and spur them to action. This is because text messages often get higher open and response rates thanks to real-time delivery to the customers’ mobile devices.

How to choose a dunning management software

Choosing the right dunning management software starts with understanding how payment failures affect your subscriptions and revenue. The best tools support recovery without creating friction for customers or extra work for your team.

When evaluating dunning software, look for the following:

  1. Flexible dunning rules and timing: The software should let you control retry schedules, reminder timing, cancellation thresholds, and escalation logic so dunning aligns with your billing policies.
  2. Support for multiple payment recovery methods: Look for features that handle card retries, payment method updates, and overdue invoice follow-ups without requiring manual intervention.
  3. Clear visibility into failed and past-due payments: Reporting and filtering tools should make it easy to identify at-risk accounts, understand why payments failed, and prioritize follow-up.
  4. Customer-friendly self-service options: Customers should be able to update payment details, resolve overdue balances, or reactivate subscriptions without contacting support.
  5. Automation with room for human intervention: The system should handle routine dunning actions automatically while allowing teams to step in for high-value or complex cases.

The right dunning management software supports consistent payment recovery while preserving customer relationships. By focusing on flexibility, visibility, and ease of use, SaaS teams can reduce involuntary churn and maintain predictable recurring revenue.

Automate dunning managementwith Maxio

Dunning management is one of the most effective ways for SaaS companies to recover revenue from billing failures and reduce overdue invoices. When handled correctly, it helps prevent churn caused by billing issues rather than customer intent.

To get the most value from dunning, best practices like automated card updates, payment reminders, and retry logic need to work together within a system designed to support them. Maxio’s subscription management and billing software brings these capabilities into a single platform, making it easier to automate dunning workflows while maintaining a positive customer experience.By combining automation with clear rules and flexible controls, teams can recover more revenue with less manual effort. Get a demo to see how Maxio supports effective dunning management at scale.

SaaS companies rely on measurable performance data to understand how well they’re growing and retaining customers. Tracking the right metrics makes it easier to spot patterns in revenue and customer value. Without consistent measurement, teams risk missing early signs of churn or weak cash flow.

SaaS metrics connect financial performance with customer behavior. They reveal how product decisions and pricing affect long-term results. Accurate, repeatable tracking gives leaders confidence in forecasts and keeps teams aligned around measurable goals.

The margin for error is slim when building a successful B2B SaaS company, which makes measuring the right metrics at the right time essential. This guide outlines the most important SaaS metrics for understanding performance and driving sustainable growth. By tracking and analyzing them consistently, you can improve forecasting and make more informed decisions across your business.

Key Takeaways

  • Tracking the right SaaS metrics helps you understand revenue patterns, customer behavior, and long-term stability.
  • Financial metrics like MRR, ARR, and ACV show how predictable your income is and how well your pricing plans perform.
  • Retention metrics such as churn, NRR, and renewal rate reveal the strength of customer relationships and the health of your subscription base.
  • Acquisition metrics like CAC and activation rate help you see how efficiently you turn new users into paying customers.
  • Reviewing these metrics often gives you better forecasts, sharper decisions, and a clearer path to steady growth.

What are SaaS metrics?

SaaS metrics provide a clear measure of how a subscription business performs over time. They reveal customer behavior, revenue patterns, and the overall health of daily operations. Since recurring payments shape the software-as-a-service model, tracking these numbers helps teams understand long-term financial stability and the strength of their customer base.

Many of these SaaS metrics are not found in your traditional P&L, so ensuring appropriate processes and systems are in place to create visibility to these metrics is critical. Regularly reviewing these metrics helps leaders spot changes, see how product and pricing choices affect results, and adjust plans with reliable data. They offer a clear view of how well the business attracts and retains customers, guiding decisions that support steady growth.

15 Key SaaS metrics every SaaS business should track

Knowing which numbers actually matter can make or break a SaaS company’s growth. These 15 key SaaS metrics give you a complete picture of how your business is performing and where you can improve.

Financial health and revenue metrics

The following financial health SaaS revenue metrics show how consistently your income flows in and how efficiently your business generates and manages revenue. Tracking these financial metrics helps you understand growth, performance, and overall financial health.

1. Monthly recurring revenue (MRR)

Monthly recurring revenue (MRR) measures the predictable income your SaaS company earns from active subscriptions each month. It standardizes revenue reporting across different pricing plans, discounts, and billing terms, giving you a consistent view of recurring performance and growth. Tracking this metric over time is critical for businesses with month-to-month commercial  models.

  • Formula: sum of current monthly fees /  number of active customers
  • Example: If you have 200 active customers each paying $50 per month, your MRR is $10,000.
  • Why it matters: MRR is your baseline for measuring month-over-month growth. Investors look at this number to gauge how stable your revenue stream is, and internal teams use it to set realistic budgets and sales targets.

2. Annual recurring revenue (ARR)

Annual recurring revenue (ARR) measures the total predictable revenue your SaaS business generates from active subscriptions over a 12-month period of time. ARR calculation provides a clear view of long-term growth, retention, and revenue stability, especially for companies with annual or multi-year contracts. This metric will be front-and-center for SaaS businesses that primarily rely on annual.

  • Formula: MRR × 12
  • Example: If your company earns $10,000 in MRR, your ARR is $120,000.
  • Why it matters: ARR gives you the big-picture view that MRR can’t capture. It’s particularly useful when evaluating annual contracts and showing potential investors that your business model can scale year over year.

3. Annual contract value (ACV)

Annual contract value (ACV) measures the average yearly revenue from a customer contract. It normalizes revenue across deals of different lengths, helping you compare customer value, segment performance, and sales efficiency. Businesses with multi-year, ramped contracts may find this metric more useful and forward-looking than ARR.

  • Formula: Total contract value ÷ contract length (in years)
  • Example: A 2-year contract worth $24,000 results in an ACV of $12,000.
  • Why it matters: ACV helps you compare deals of different sizes and lengths on equal footing. Sales teams use this to prioritize high-value opportunities, and finance teams rely on it for accurate revenue projections.

4. Expansion revenue

Expansion revenue is the additional recurring revenue generated from existing customers through upgrades, add-ons, or expanded usage. It reflects how well your business grows customer value over time and reduces reliance on acquiring new customers for revenue growth. Understanding Expansion Revenue is important to understanding movements in your Net Revenue Retention rate, a SaaS metric we will cover later in this post.

  • Formula: Revenue from existing customers at the end of a period – revenue from those same customers at the start of the period
  • Example: If a customer paid $1,000 per month at the start of the year and now pays $1,300 after upgrading, the expansion revenue is $300.
  • Why it matters: Growing revenue from your existing base costs less than chasing new customers. High expansion revenue indicates that customers see ongoing value in your SaaS product, which often correlates with lower churn rates.

5. Gross margin

Gross margin measures how efficiently your SaaS business delivers its product or service after accounting for direct costs. It represents the percentage of revenue that remains once expenses like hosting, support, and third-party tools are subtracted, showing how much you keep as profit from sales. This P&L metric is applicable to all businesses – SaaS included.

  • Formula: (Total revenue – cost of goods sold) ÷ total revenue × 100
  • Example: If your company earns $200,000 in revenue and has $50,000 in costs, your gross margin is 75%.
  • Why it matters: This percentage tells you how much room you have to invest in growth. A margin below 70% might signal that your infrastructure costs are eating into profits, while margins above 80% suggest efficient operations.

6. Payback period (CAC payback period)

Payback period (CAC payback period) measures how long it takes for a new customer to generate enough revenue to cover the cost of acquiring them. It shows how quickly your company recoups its marketing and sales investments and begins earning profit from new customers. Investors view this metric as a way to evaluate whether a business has a sustainable commercial model that supports a profitable business long-term.

  • Formula: Customer acquisition cost ÷ monthly recurring revenue per customer
  • Example: If your average CAC is $1,200 and each customer brings in $200 in MRR, your payback period is six months.
  • Why it matters: The faster you recover acquisition costs, the sooner you can reinvest that cash into more growth. Most healthy SaaS companies aim for payback periods under 12 months to maintain efficient scaling.

Customer value and retention metrics

The following customer value and retention metrics show how well your business attracts and retains customer relationships. Tracking them helps you understand satisfaction, loyalty, and the long-term value each customer brings to your company.

7. Customer retention rate

SaaS customer retention rate measures the percentage of customers your business keeps over a specific period. It shows how well you maintain long-term relationships and deliver ongoing value that encourages renewals or continued subscriptions.

  • Formula: ((Customers at end of period – new customers acquired) ÷ customers at start of period) × 100
  • Example: If you start the quarter with 500 customers, gain 100 new ones, and end with 550, your retention rate is 90%.
  • Why it matters: Retention is cheaper than acquisition. When customers stick around, you’re building a stable revenue foundation that compounds over time. Retention rates above 85% are common in healthy SaaS businesses.

8. Churn rate

Churn rate measures how much business your company loses over a set period. It helps you understand customer satisfaction, product fit, and overall revenue stability. As far as non-P&L metrics go, this (along with NRR, MRR, ARR, or ACV) is one of the most critical metrics in understanding the health of a business’s overall revenue base for operators and investors alike.

There are several types of churn rates worth tracking:

Customer churn rate

Customer churn rate measures the percentage of customers who cancel or stop using your service within a specific timeframe. It’s one of the clearest indicators of retention and customer experience. Most SaaS companies report churn between 5% and 7%.

  • Formula: (Customers lost ÷ customers at start of period) × 100
  • Example: If you start with 400 customers and lose 20, your churn rate is 5%.
  • Why it matters: Every churned customer represents lost revenue and wasted acquisition costs. Tracking churn by customer segment or product tier helps you identify where the experience is breaking down and where to focus retention efforts.
Revenue churn rate

Revenue churn rate tracks the percentage of recurring revenue lost, excluding new revenue gained in the same period.

  • Formula: (Previous revenue – current revenue) ÷ previous revenue × 100
  • Example: If revenue drops from $100,000 to $90,000, your revenue churn is 10%.
  • Why it matters: Losing a $10,000/month enterprise customer has a very different impact than losing ten $100/month accounts. Revenue churn shows you the actual financial damage from customer losses, which often matters more than counting churned accounts alone.
Recurring revenue churn (ARR/MRR)

Recurring revenue churn focuses on recurring income, showing how much MRR or ARR is lost through cancellations or downgrades.

  • Formula: Churned MRR ÷ previous month’s MRR × 100
  • Example: If MRR decreases from $10,000 to $9,000, your churn rate is 10%.
  • Why it matters: This metric isolates the health of your subscription base. If recurring revenue churn stays below 5% monthly, your business can grow sustainably. Anything above 10% demands immediate attention to customer success and product quality.

9. Net revenue retention (NRR)

Net revenue retention (NRR) measures how much recurring revenue you retain from existing customers over a given period, including upgrades, downgrades, and churn. It reflects the net impact of customer expansion and contraction without factoring in new customer revenue. Put simply, it answers the question of “what will $100 from a customer today likely be 12 months from now? A high NRR signals a business with both a healthy revenue base and an ability to “land and expand” within new accounts.

  • Formula: ((Starting MRR + expansion MRR – churned MRR – contraction MRR) ÷ starting MRR) × 100
  • Example: If you start the month with $100,000 in MRR, add $15,000 from expansions, and lose $10,000 from churn and downgrades, your NRR is 105%.
  • Why it matters: NRR shows how well your business grows revenue from its existing customer base. A rate above 100% means your current customers are driving net growth, while a rate below 100% signals revenue loss that needs to be addressed through retention or expansion efforts.

When comparing gross retention vs. net retention, remember that gross retention only measures how much recurring revenue you keep after churn and downgrades, ignoring any expansion. Net retention includes upsells and cross-sells, giving a fuller picture of how existing customers contribute to overall growth.

10. Customer lifetime value (CLV or LTV)

Customer lifetime value (CLV or LTV) measures the total revenue your business can expect to earn from a customer over the entire duration of their relationship. It helps you understand long-term profitability and determine how much you can spend to acquire and retain customers.

  • Formula: Average revenue per account × gross margin × average customer lifespan
  • Example: If a customer generates $1,000 per year, with a 70% gross margin and an average lifespan of 3 years, their LTV is $2,100.
  • Why it matters: LTV sets your acquisition budget ceiling. If you know a customer is worth $2,100 over three years, you can justify spending more upfront to win them. Comparing LTV across customer segments also reveals which types of accounts deliver the best returns.

11. Renewal rate

SaaS renewal rate measures the percentage of customers who renew their subscription or contract at the end of a term. It reflects how well your product meets customer needs and how effectively your team maintains long-term relationships. This metric drives NRR, and is a more practical metric for setting goals for your teams that drive renewals, as it is truly only measuring what is actually renewing in the period – not the entire base.

  • Formula: (Number of customers who renewed ÷ number of customers up for renewal) × 100
  • Example: If 180 out of 200 customers renew their contracts, your renewal rate is 90%.
  • Why it matters: Renewals are your earliest warning system for product-market fit issues. If customers aren’t renewing, it’s a clear signal that something isn’t working. Strong renewal rates (above 85%) indicate that your product delivers consistent value that customers want to pay for again.

Many companies use renewal management software to track upcoming renewals and proactively address at-risk accounts before they churn.

Acquisition and satisfaction metrics

The following acquisition and satisfaction metrics show how effectively your business attracts new customers and keeps them happy. Tracking these helps you evaluate the efficiency of your marketing and sales efforts while understanding how satisfied customers are after they join.

12. Activation rate

Activation rate measures the percentage of new users who complete a key action that indicates they’ve experienced the core value of your product. It helps you understand how effectively you onboard customers and move them from sign-up to engagement.

  • Formula: (Activated users ÷ total new users) × 100
  • Example: If 500 new users sign up in a month and 300 complete an activation milestone, your activation rate is 60%.
  • Why it matters: Users who never activate rarely become paying customers. Tracking activation helps you spot where onboarding friction occurs and which features drive early engagement. Improving activation by even 10% can significantly boost long-term retention.

13. Customer acquisition cost (CAC)

Customer acquisition cost (CAC) measures how much your business spends to acquire a new customer. It includes marketing, sales, and related expenses and helps evaluate how efficiently your company turns qualified leads into paying customers. This is the key building block for calculating CAC Payback and CAC ratio.

  • Formula: (Total sales and marketing costs ÷ number of new customers acquired)
  • Example: If your company spends $50,000 on marketing and sales in a quarter and gains 250 new customers, your CAC is $200.
  • Why it matters: CAC tells you whether your growth is sustainable. If you’re spending $500 to acquire customers who only generate $300 in lifetime value, you’re losing money on every sale. Successful SaaS companies try to maintain a CAC to LTV ratio of at least 1:3.

14. CAC ratio

CAC ratio measures how efficiently your company turns customer acquisition costs into recurring revenue. It compares the cost of gaining new customers to the revenue they generate, showing how sustainable your growth strategy is. This metric isn’t just valuable for measuring historical efficiency; it is a great metric to check future budgets and forecasts against to ensure you aren’t setting targets that indicate overinvestment in GTM spend or underperformance on new bookings.

  • Formula: (New recurring revenue for the period ÷ total sales and marketing spend)
  • Example: If you spend $100,000 on sales and marketing in a quarter and generate $40,000 in new recurring revenue, your CAC ratio is 0.4.
  • Why it matters: A CAC ratio between 0.5 and 1.0 indicates healthy, efficient growth. Ratios below 0.5 mean you’re spending too much relative to the revenue coming in. Ratios above 1.0 signal very efficient acquisition, which might mean you have room to invest more in growth.

15. Net promoter score (NPS)

Net Promoter Score (NPS) measures customer satisfaction and loyalty by asking how likely users are to recommend your product or service to others. It helps you gauge overall sentiment and identify opportunities to improve the customer experience.

  • Formula: % Promoters (scores 9-10) – % Detractors (scores 0-6)
  • Example: If 60% of respondents are Promoters and 20% are Detractors, your NPS is 40.
  • Why it matters: NPS gives you a pulse check on customer sentiment that often predicts churn before it happens. Scores above 50 are considered excellent in SaaS, while anything below 0 signals serious problems with product satisfaction or customer support.

How these SaaS metrics impact your business

Understanding and tracking important metrics is about more than reporting numbers. These insights guide smarter decisions across every part of your business, from pricing and retention to marketing performance and financial planning.

Pricing strategy

Tracking ACV, LTV, and gross margin reveals which plans perform well and which need adjustment. This data helps you refine pricing models and test changes based on real revenue patterns rather than assumptions.

Retention and customer experience

Churn rate and NPS show how customers feel about your product and where they’re leaving. These numbers indicate whether issues stem from onboarding, support, or product fit. Addressing them early keeps customers longer and stabilizes recurring revenue.

Marketing and sales efficiency

CAC and payback period measure how efficiently your company turns prospects into paying users. Comparing these to revenue growth uncovers which acquisition efforts actually pay off, helping teams focus spend on what drives the strongest returns.

Financial forecasting and planning

MRR, ARR, and NRR provide a dependable view of recurring income and future performance. They clarify how upgrades, renewals, and churn affect growth, allowing leadership to plan budgets and product investments more confidently.

How to improve your SaaS metrics

Improving SaaS metrics starts with knowing what drives them. The goal is to build habits and systems that make your data more reliable and your decisions more effective.

  1. Review metrics regularly: Use SaaS reporting tools to check performance each month. Regular analysis helps you respond quickly and address problems before they escalate.
  2. Refine pricing and packaging: Use LTV, ACV, and MRR data to adjust subscription pricing. Test changes that reflect customer behavior and match the value they receive.
  3. Focus on retention: Keep existing customers engaged through regular check-ins, helpful content, and strong account management. Consistent attention improves renewals and reduces churn.
  4. Optimize acquisition channels: Analyze CAC and conversion rates to identify which sources bring in quality customers. Shift spending toward channels that deliver steady growth and better payback.
  5. Automate reporting: Centralize information with automated SaaS dashboards and forecasting tools. This improves accuracy, saves time, and gives your team faster insight into performance.

Improving SaaS metrics is an ongoing process. By tracking, testing, and refining your approach, you create a more predictable and sustainable growth model.

Stay on top of your B2B SaaS metrics with Maxio

Reliable metrics start with consistent calculations. When teams rely on Excel spreadsheets or change formulas without a clear process, accuracy slips fast. Numbers stop lining up, reports lose credibility, and it becomes harder to see how the business is really performing.

At Maxio, we’re equipped to manage the ins and outs specific to the SaaS industry: revenue recognition, subscription billing, subscription management, metrics & analytics, CPQ, and more. With the power to calculate 100 SaaS finance and analytical metrics at the touch of a button, we make sure you have the numbers you need when you need them.

If you’re interested in crunching your numbers, download our metrics template to get started with your calculations. If you’d like to learn more about how the Maxio platform can help you manage your business more effectively, reach out to get a demo of our platform for free and see how we can help your business grow.

Get Your Free SaaS Metrics Template

Template provides you with a comprehensive set of pre-built SaaS metrics (that you can trust) to wow investors and make key business decisions with confidence

FAQS

What is the most important metric for SaaS?

Every SaaS metric helps explain performance, but ARR is often considered the most important. It shows how much predictable revenue your business earns each year and gives a clear picture of growth and stability over time.

Keep track of ARR and other key SaaS metrics with our metrics template.

What is the Rule of 40 in SaaS?

The Rule of 40 is a benchmark used to evaluate a SaaS company’s balance between growth and profitability. It states that a company’s revenue growth rate plus profit margin should equal or exceed 40%. Hitting this mark suggests efficient operations and sustainable growth, which often leads to stronger valuations.

Why should SaaS companies use a metrics dashboard?

SaaS companies should use a metrics dashboard to keep all key performance data in one place. A centralized dashboard gives teams real-time visibility into revenue, churn, retention, and other core metrics without switching between tools or spreadsheets.

It also helps leaders make data-driven decisions and stay aligned on goals across departments. Over time, this consistency improves accuracy, accountability, and overall business performance.

How do lifecycle metrics help SaaS companies grow?

Lifecycle metrics show how customers interact with your product over time. They highlight where users find value, where they lose interest, and when they’re most likely to renew or upgrade.

Understanding these patterns allows teams to improve onboarding and build steadier revenue growth.